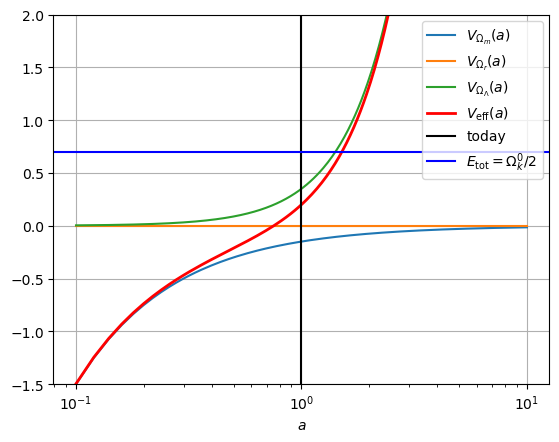
To understand Friedmann equation terms.
import numpy as np
import matplotlib.pyplot as plt
def Vm(a, Om):
return -0.5 * Om/a
def Vk(Om, Or, OL):
return 0.5*((1-Om-Or-OL))
def Vr(a, Or):
return -0.5*Or/a**2
def VL(a, OL):
return -0.5*OL*a**2def Veff(a, Om, Or, OL):
return Vm(a,Om) + Vr(a,Or) + VL(a,OL)def plot_Vs(Om, Or, OL, ylim=None):
a=np.linspace(0.1, 10, 500)
fig = plt.figure()
plt.plot(a, Vm(a, Om), label=r"$V_{\Omega_m}(a)$")
plt.plot(a, Vr(a, Or), label=r"$V_{\Omega_r}(a)$")
plt.plot(a, VL(a, OL), label=r"$V_{\Omega_\Lambda}(a)$")
plt.plot(a, Veff(a, Om, Or, OL), "r-", lw=2, label=r"$V_{\mathrm{eff}}(a)$")
plt.axvline(1, color="k", label="today")
plt.axhline(Vk(Om,Or,OL), color="b", label=r"$E_{\mathrm{tot}}=\Omega_k^0/2$")
plt.xscale("log")
plt.legend()
plt.xlabel("$a$")
plt.ylim(ylim)
plt.grid()
plt.show()
Om, Or, OL = 1., 0, 0
plot_Vs(Om, Or, OL)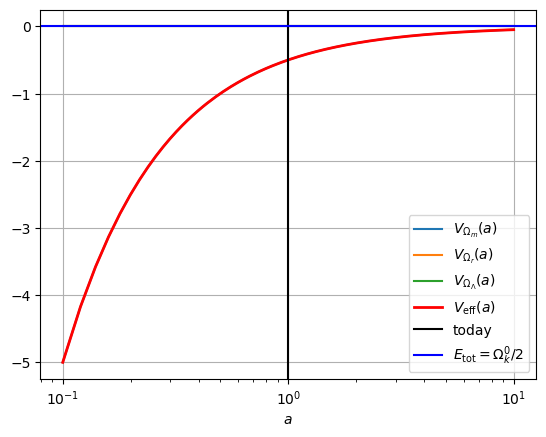
Om, Or, OL = 1.5, 0, 0
plot_Vs(Om, Or, OL)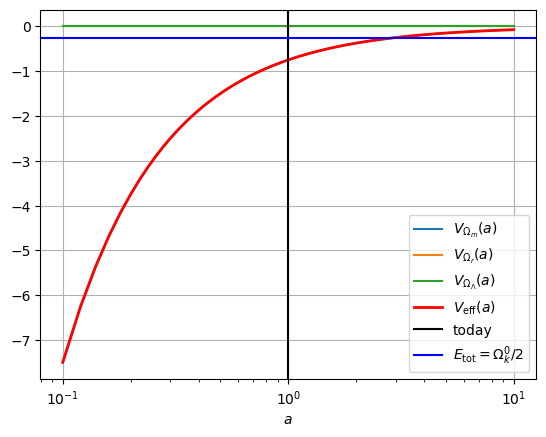
Om, Or, OL = 0.5, 0, 0
plot_Vs(Om, Or, OL)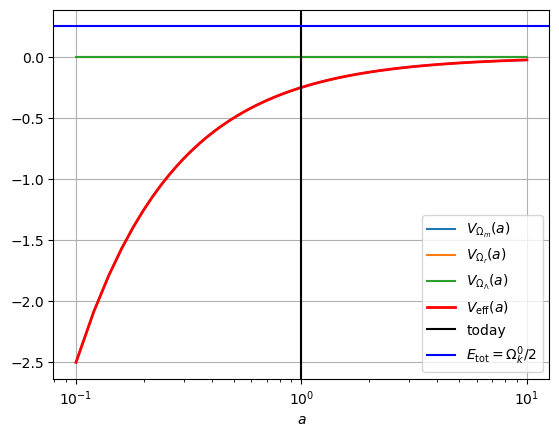
Om, Or, OL = 1, 0, 0.5
plot_Vs(Om, Or, OL, ylim=(-6,1))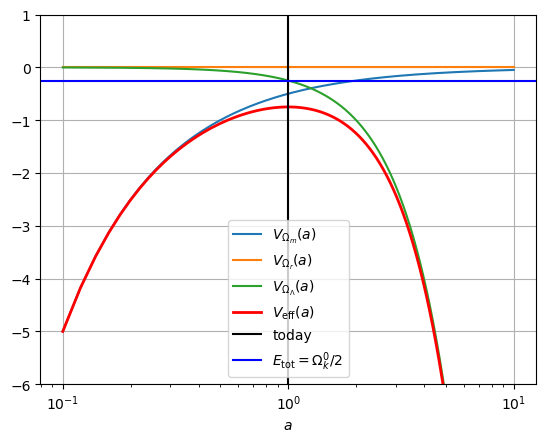
Om, Or, OL = 0.3, 0, 0.7
plot_Vs(Om, Or, OL, ylim=(-3, 1))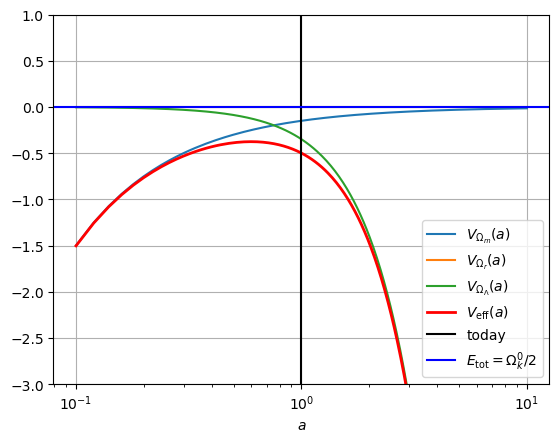
Om, Or, OL = 0.3, 0, 0.5
plot_Vs(Om, Or, OL, ylim=(-3, 1))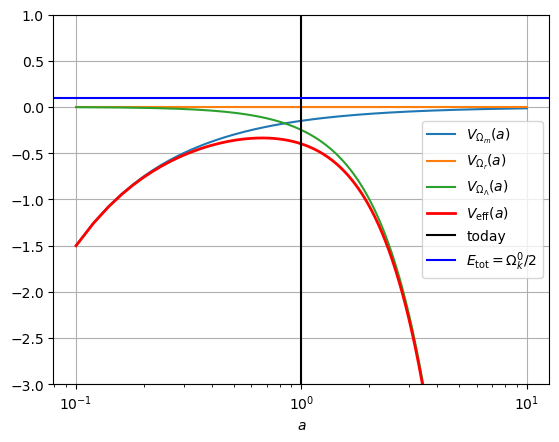
Om, Or, OL = 0.3, 0, 1.5
plot_Vs(Om, Or, OL, ylim=(-3, 1))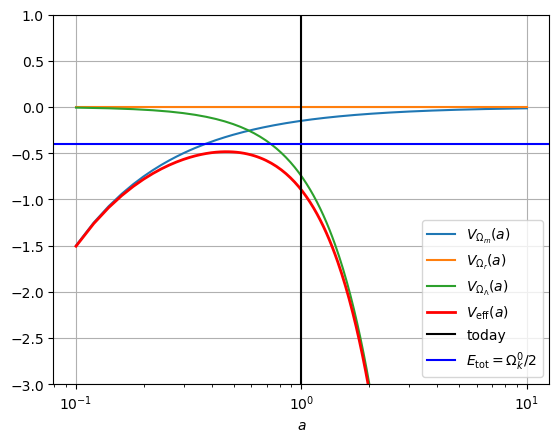
Om, Or, OL = 0.3, 0, -0.7
plot_Vs(Om, Or, OL, ylim=(-1.5, 2))