1A simple Hubble diagram
The luminosity distance is defined as follows:
In the joined data file, the most recent type Ia supernovae measurements from SNLS collaboration have been reported Betoule et al. 2014. 740 good quality supernovae are present with their name, their redshift (zcmb) and their rest-frame band peak magnitude (mb) with its uncertainty (dmb). They are sorted by redshift in ascending order.

First, initialize the notebook and make the plot so as it looks like the one in figure above.
# initialisation og the notebook
import numpy as np
import matplotlib.pylab as plt
import matplotlib
import matplotlib.cm as cm
from astropy.cosmology import LambdaCDM
import astropy.units as u

%matplotlib inline
import pandas as pd
df = pd.read_csv("data/sne_data_zsorted.txt", delimiter="\t")
dffig = plt.figure()
plt.errorbar(x=df['zcmb'],y=df['mb'],xerr=np.abs(df['dz']),yerr=df['dmb'],fmt='o',color='b',markersize=1)
plt.xlabel('$z$',size='14')
plt.xlim([0.000,1.4])
plt.ylabel('$m^*_{B}$ [mag]',size='14')
plt.grid()
plt.show()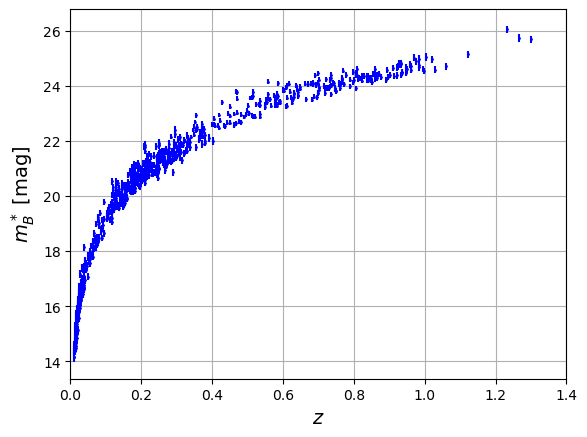
As the cosmological models that fit data are compatible with a flat universe, in the array
dLcompute the luminosity distance assuming a flat universe. Then setmagarray as:
Set with the M variable and the value you found in the previous exercise. Superimpose on the Hubble diagram and comment.
cosmo = LambdaCDM(Om0=0.3, Ode0=0.7, H0=70)
MB = -19.08
M = MB - 5*np.log10(10*u.parsec / cosmo.hubble_distance)
print(M)
24.078613314568358
z = np.linspace(0.01, 1.4, 50)

fig = plt.figure()
cosmo = LambdaCDM(Om0=0.3, Ode0=0.7, H0=75)
plt.plot(z, cosmo.distmod(z),'b-',lw=2, label=f"$\Omega_m^0=0.3$, $\Omega_\Lambda^0=0.7$, $H_0=75\,$km/s/Mpc")
cosmo = LambdaCDM(Om0=0.3, Ode0=0.7, H0=65)
plt.plot(z, cosmo.distmod(z),'b--',lw=2, label=f"$\Omega_m^0=0.3$, $\Omega_\Lambda^0=0.7$, $H_0=65\,$km/s/Mpc")
cosmo = LambdaCDM(Om0=1, Ode0=0., H0=75)
plt.plot(z, cosmo.distmod(z),'r-',lw=2, label=f"$\Omega_m^0=1$, $\Omega_\Lambda^0=0$, $H_0=75\,$km/s/Mpc")
plt.xlabel('$z$',size=14)
plt.xlim([0.000,1.4])
plt.ylabel('$\mu(z)$',size=14)
plt.legend(fontsize='14')
plt.grid()
plt.tight_layout()
plt.show()
def mu_f(z, OmegaM, OmegaL, M, H0=70):
    cosmo = LambdaCDM(Om0=OmegaM, Ode0=OmegaL, H0=H0)
    return 5*np.log10(cosmo.luminosity_distance(z)/cosmo.hubble_distance) + M

z = np.linspace(0.01, 1.4, 50)
mu = mu_f(z, 0.3, 0.7, M)
To check the quality of the fit, first complete the
deltaarray with and compute s for each SNIa in arraychisq. In the fit control table, in cellRMScompute the standard deviation of thedeltaarray. In celltotal_chisqcompute the total as the sum of thechisqarray. Compare the latter with the number of measurements.
from scipy.optimize import curve_fit

pval, pcov = curve_fit(mu_f, df['zcmb'], df['mb'], sigma=df['dmb'], p0=(0.3,0.7,24), absolute_sigma=True)
print(pval)
[ 0.3748276 0.32227609 24.10833295]
#### To complete
delta =  df['mb'] - mu_f(df['zcmb'], *pval)
chisq =  delta**2/df['dmb']**2

# Fit control table
RMS =                 np.std(delta)
total_chisq =         np.sum(chisq)
####

print('RMS: ',RMS)
print('Total chisq: ',total_chisq)
RMS: 0.2804584476461635
Total chisq: 4578.591303886714
fig = plt.figure()
plt.errorbar(x=df['zcmb'],y=df['mb'],xerr=np.abs(df['dz']),yerr=df['dmb'],fmt='.',capsize=2,lw=1,color='k',markersize=1)
plt.plot(z, mu_f(z, *pval),'r-',lw=2, label=f"$\Omega_m^0={pval[0]:.2f}$"+"\n"+f"$\Omega_\Lambda^0={pval[1]:.2f}$")
plt.xlabel('$z$',size=14)
plt.xlim([0.000,1.4])
plt.ylabel('$m^*_{B}(z)$',size=14)
plt.legend()
plt.grid()
plt.show()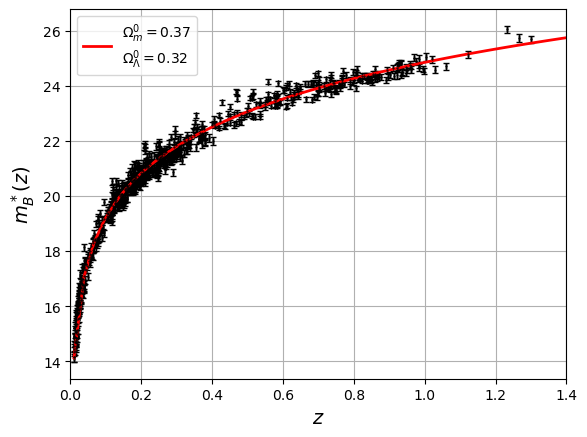
fig = plt.figure()
plt.errorbar(x=df['zcmb'],y=delta,xerr=np.abs(df['dz']),yerr=df['dmb'],fmt='.',color='b',markersize=1)
plt.plot(z,np.zeros_like(z),'r-',lw=2)
plt.xlabel('$z$',size='14')
plt.xlim([0.000,1.4])
plt.ylabel('$m^{*}_{B}(z) - m^{*}_{B,\mathrm{model}}$ [mag]',size='14')
plt.grid()
plt.show()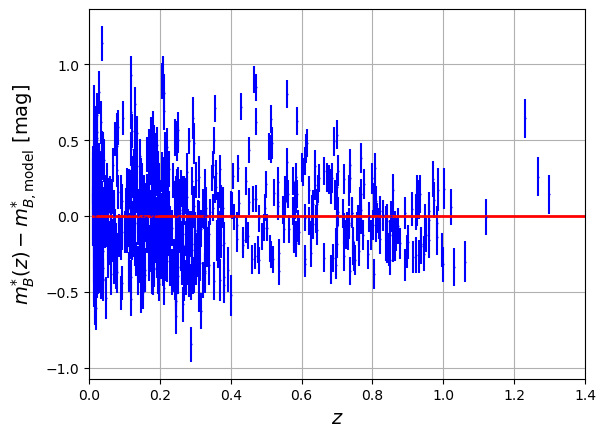
fig = plt.figure()
sc = plt.scatter(x=df['zcmb'], y=delta, marker='+', s=15, linewidths=2, c=df['x1'], cmap=plt.colormaps['Blues'])
#create colorbar according to the scatter plot
clb = plt.colorbar(sc, extend='both')
clb.set_label(label="$x_1$", size=14)

#convert third variable to a color tuple using the colormap used for scatter
norm = matplotlib.colors.Normalize(vmin=min(df['x1']), vmax=max(df['x1']), clip=True)
mapper = cm.ScalarMappable(norm=norm, cmap='Blues')
color_l = np.array([(mapper.to_rgba(v)) for v in df['x1']])

#loop over each data point to plot
for x, y, e, color in zip(df['zcmb'], delta, df['dmb'], color_l):
    plt.plot(x, y, 'o', color=color)
    plt.errorbar(x, y, e, lw=1, capsize=2, color=color)

plt.plot(z,np.zeros_like(z),'r-',lw=2)
plt.xlabel('$z$',size='14')
plt.xlim([0.000,1.4])
plt.ylabel('$m^{*}_{B} - [\mu(z) + M_B]$ [mag]',size='14')
plt.grid()
plt.show()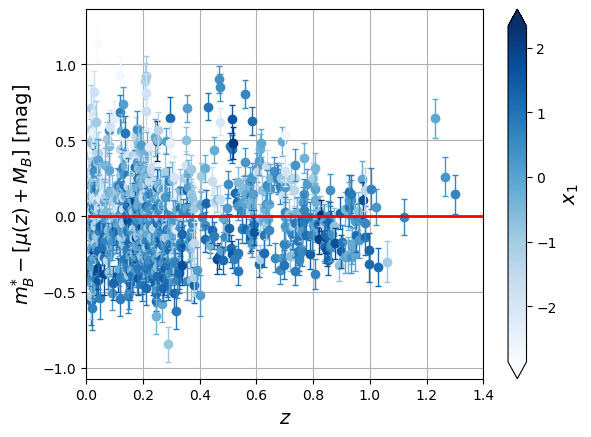
fig = plt.figure()
sc = plt.scatter(x=df['zcmb'],y=delta, marker='+', s=15, linewidths=2, c=df['color'], cmap=plt.colormaps['Reds'])
#create colorbar according to the scatter plot
clb = plt.colorbar(sc, extend='both')
clb.set_label(label="$c$", size=14)

#convert third variable to a color tuple using the colormap used for scatter
norm = matplotlib.colors.Normalize(vmin=min(df['color']), vmax=max(df['color']), clip=True)
mapper = cm.ScalarMappable(norm=norm, cmap='Reds')
color_l = np.array([(mapper.to_rgba(v)) for v in df['color']])

#loop over each data point to plot
for x, y, e, color in zip(df['zcmb'], delta, df['dmb'], color_l):
    plt.plot(x, y, 'o', color=color)
    plt.errorbar(x, y, e, lw=1, capsize=2, color=color)

plt.plot(z,np.zeros_like(z),'r-',lw=2)
plt.xlabel('$z$',size='14')
plt.xlim([0.000,1.4])
plt.ylabel('$m^{*}_{B} - [\mu(z) + M_B]$ [mag]',size='14')
plt.grid()
plt.show()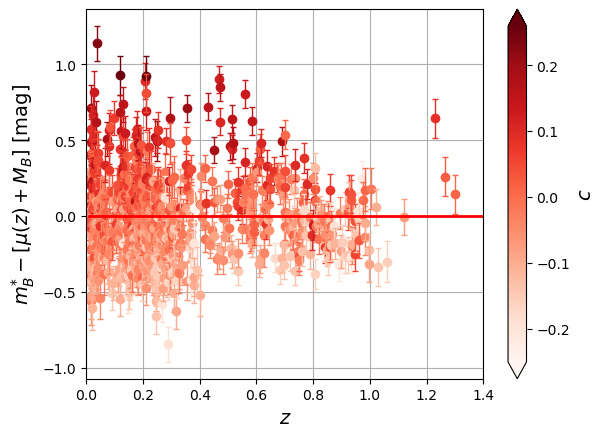
Comment the value of
total_chisqandRMS.
The total value of total_chisq is huge compared to 740 : it means that the fit is bad even for a good-looking fit on the plot. The spread of data around the model is too important: RMS is around 0.3 mag.
2Corrected magnitudes
Actually, the type Ia supernovae are not so standard. They have little systematic variability that depends on their color or their time length (Astier et al. 2001). For instance, the longer is the supernovae the brighter it is also (the brighter-slower rule). These systematic bias can be removed to make more standard candles and increase the quality of the data sample.
In the data file, the color column gives the color in the band and the “stretch” parameter x1 measures the duration of the supernova. They are given with their uncertainties.
First, make a scatter plot of
mb-magversusx1. Add the uncertainties and fit the plot by a line: . Print the equation of the fit and comment it.
#### To complete
fit,cov = np.polyfit(  x=df['x1'],y=delta,deg=1,cov=True,w=1/df['dmb'])
alpha =            fit[0]
alpha_err =        np.sqrt(cov[0,0])
####

line_alpha = np.polyval(fit, df['x1'])
print('Alpha value: ',alpha,' +/- ',alpha_err)
Alpha value: -0.1128704517377774 +/- 0.009782982675423414
fig = plt.figure()
ax = fig.add_subplot(111)
plt.errorbar(x=df['x1'], y=delta, xerr=df['dx1'],yerr=df['dmb'], fmt='.',color='b',markersize=1)
plt.plot(df['x1'], line_alpha, 'r-', lw=2)
ax.set_xlabel('$\mathtt{x1}$', size='14')
ax.set_ylabel('$m^{*}_{B}(z)- m^{*}_{B,\mathrm{model}}$ [mag]', size='14')
plt.show()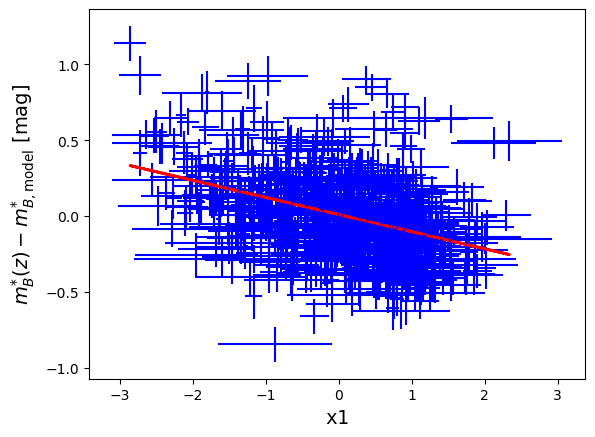
We see a systematic trend between the data points: it means that the supernovae are not so standard and that their magnitude depends on un-modelled physical properties. The fit gives .
Then, make a scatter plot of
mb-magversuscolor. Add the uncertainties and fit the plot by a line: . Print the equation of the fit on the plot and comment it.
#### To complete
fit,cov = np.polyfit(   x=df['color'],y=delta,deg=1,    cov=True,w=1/df['dcolor'])
beta =            fit[0]
beta_err =        np.sqrt(cov[0,0])
####

line_beta = np.polyval(fit, df['color'])
print('Beta value: ',beta,' +/- ',beta_err)
Beta value: 2.7342201610653505 +/- 0.08755128241575162
fig = plt.figure()
plt.errorbar(x=df['color'], y=delta, xerr=df['dcolor'], yerr=df['dmb'], fmt='.', color='b', markersize=1, alpha=0.1)
plt.plot(df['color'], line_beta, 'r-',lw=2)
plt.xlabel('$\mathtt{color}$',size='14')
plt.ylabel('$m^{*}_{B}(z) - m^{*}_{B,\mathrm{model}}$ [mag]',size='14')
plt.grid()
plt.show()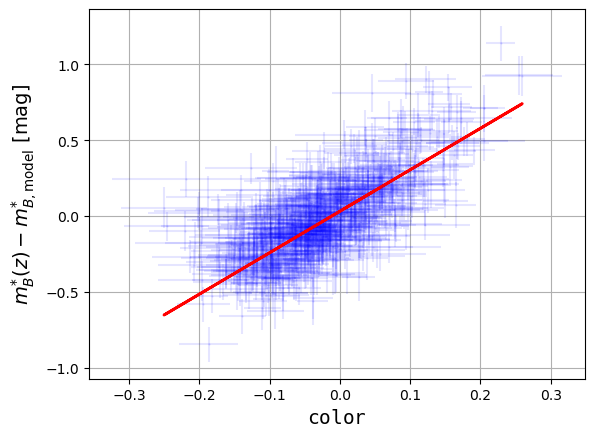
We see a systematic trend between the data points: it means that the supernovae are not so standard and that their magnitude depends on un-modelled physical properties. The fit gives (the brighter-bluer rule).
Propose a way to correct the measured magnitudes in order to remove the systematic trends that we observed. Fill the array
mb_corrwith your proposition.
#### To complete
mb_corr = df['mb'] - alpha*df['x1'] - beta*df['color']
mb_corr_err = np.sqrt(df['dmb']**2+(alpha*df['dx1'])**2+(beta*df['dcolor'])**2)
####
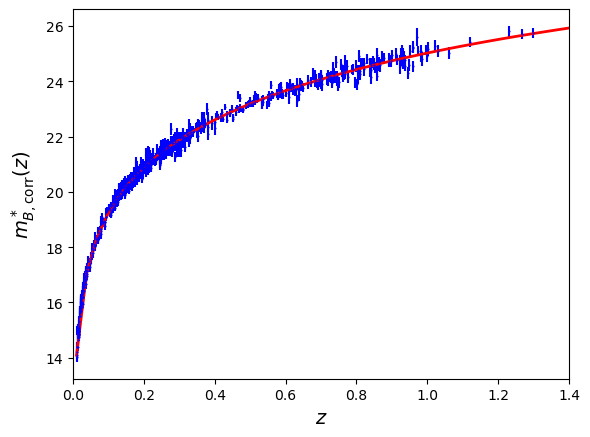
Make a new Hubble diagram using these corrected magnitudes and superimpose your cosmological model. Fill the
delta_corrandchisq_corrarrays propagating all the uncertainties, as well as theRMS_corrandtotal_chisq_corrvariables as previously for this new fit. Comment.
#### To complete
fig = plt.figure()
ax = fig.add_subplot(111)
plt.errorbar(x=df['zcmb'], y=mb_corr,xerr=np.abs(df['dz']),yerr=mb_corr_err,fmt='.',color='b',markersize=1)
plt.plot(z, mu_f(z, 0.3, 0.7, M),'r-',lw=2)
ax.set_xlabel('$z$',size='14')
ax.set_xlim([0.000,1.4])
#ax.set_ylim([-1.6,1.1])
ax.set_ylabel('$m^*_{B,\mathrm{corr}}(z)$',size='14')
#ax.set_xscale('log')
plt.show()
####
pval, pcov = curve_fit(mu_f, df['zcmb'], mb_corr, sigma=mb_corr_err, p0=(0.3,0.7,24), absolute_sigma=True)
print(pval)
[ 0.2516525 0.63296623 24.0802872 ]
#### To complete
delta_corr = mb_corr - mu_f(df['zcmb'], *pval)
chisq_corr = delta_corr**2/mb_corr_err**2

# Fit control table
RMS_corr =                 np.std(delta_corr)
total_chisq_corr =         np.sum(chisq_corr)
####

print('Corrected RMS: ',RMS_corr)
print('Corrected total chisq: ',total_chisq_corr)
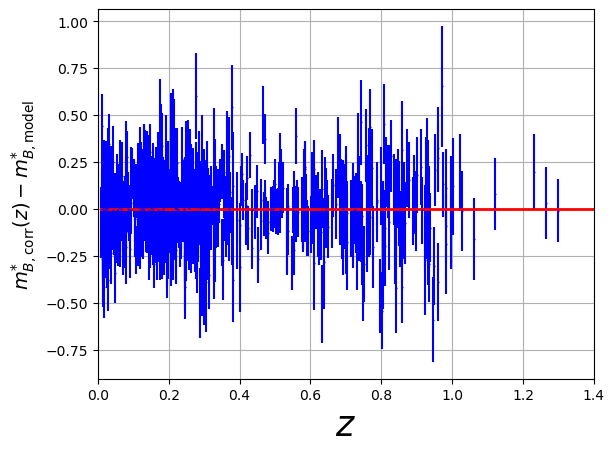
Corrected RMS: 0.1611403773821789
Corrected total chisq: 663.2587544345173
fig = plt.figure()
plt.errorbar(x=df["zcmb"], y=delta_corr, xerr=np.abs(df['dz']), yerr=mb_corr_err, fmt='.', color='b', markersize=1)
plt.plot(z,np.zeros_like(z),'r-',lw=2)
plt.xlabel('$z$',size='25')
plt.xlim([0.000,1.4])
plt.ylabel('$m^{*}_{B,\mathrm{corr}}(z) - m^{*}_{B,\mathrm{model}}$',size='14')
plt.grid()
plt.show()