1A homogeneous and isotropic universe?
The cosmological models that we have discussed postulate that the universe is homogeneous and isotropic on large scales, i.e. at distances typically greater than 100 Mpc. Below this characteristic scale, the galaxies observed in wide-field optical surveys are distributed along the cosmic web. The large structures that weave this web formed as a result of the growth of the fluctuations in the CMB. Due to the properties of gravitation, an initially ellipsoidal overdensity collapses preferentially along its smallest axis, resulting in a sheet (so called Zel’dovich pancake). These sheets can collapse in the form of filaments, which themselves converge towards galaxy clusters. The areas not populated by the cosmic web constitute the cosmic voids, which occupy most of space.
Distance from local large-scale structures
The structures that form the cosmic web arrange themselves in a network resembling that of soap bubbles (see Figure 1, left). A simplified crystallographic representation is given below (see Figure 1, right), with the characteristic cell size and the typical diameter of clusters, or the cross-section of filaments. The sheets, also called walls for the largest ones, have a thickness and and an area . Cosmological simulations suggest a void occupancy rate of the order of (see exercise below). Knowing that the characteristic radius of the clusters we observe is Mpc, we deduce a typical cell size of the order of Mpc.
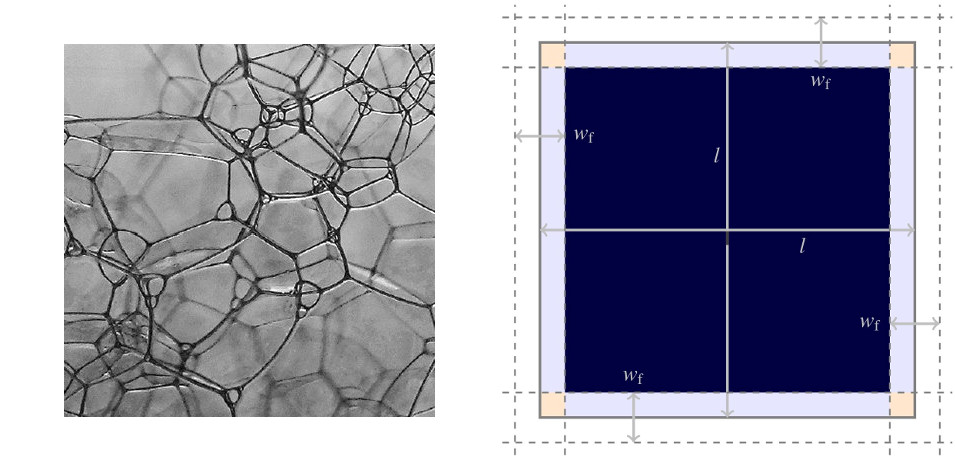
Figure 1:Network of soap bubbles and cubic model illustrating the structure of the cosmic web. On the right-hand side, the nodes in orange correspond to the clusters, the sheets and filaments are in sky blue and the voids in dark blue. Images taken from Freidel & Livine (2019) and Oei et al. (2022).
Solution to Exercise 1
In the crystallographic approach presented above, the volume filling factors of clusters, , filaments, , sheets, and voids, are
Note that the sum is equal to 1 because of the binomial identity .
The following table, adapted from Oei et al. (2022), provides a comparison between our simple estimate and values inferred in a typical set of cosmological simulations.
| Structure type | Cubic cell | Cosmic simulation results |
|---|---|---|
| Voids | 72.9% | 76% |
| Sheets | 24.3% | 18% |
| Filaments | 2.7% | 5% |
| Clusters | 0.1% | 0.5% |
Note: Large-scale cosmological simulations indicate that at , clusters and filaments encompass and of dark matter respectively. Taking into account feedback from galaxy winds and jets suggests a more diffuse baryon distribution: of baryons would be found in clusters, in filaments and sheets, in voids Haider et al., 2016.
The four types of structure (voids, sheets or walls, filaments, clusters) are visible in the distribution of nearby galaxies. Our galaxy, its neighbour Andromeda at Mpc and their satellites, such as the Large Magellanic Cloud at kpc, form the Local Group. As illustrated in Figure 2, the Local Group is at the heart of the Local Sheet. This sheet is a planar structure with a diameter of Mpc, delimiting one side of the Local Void.
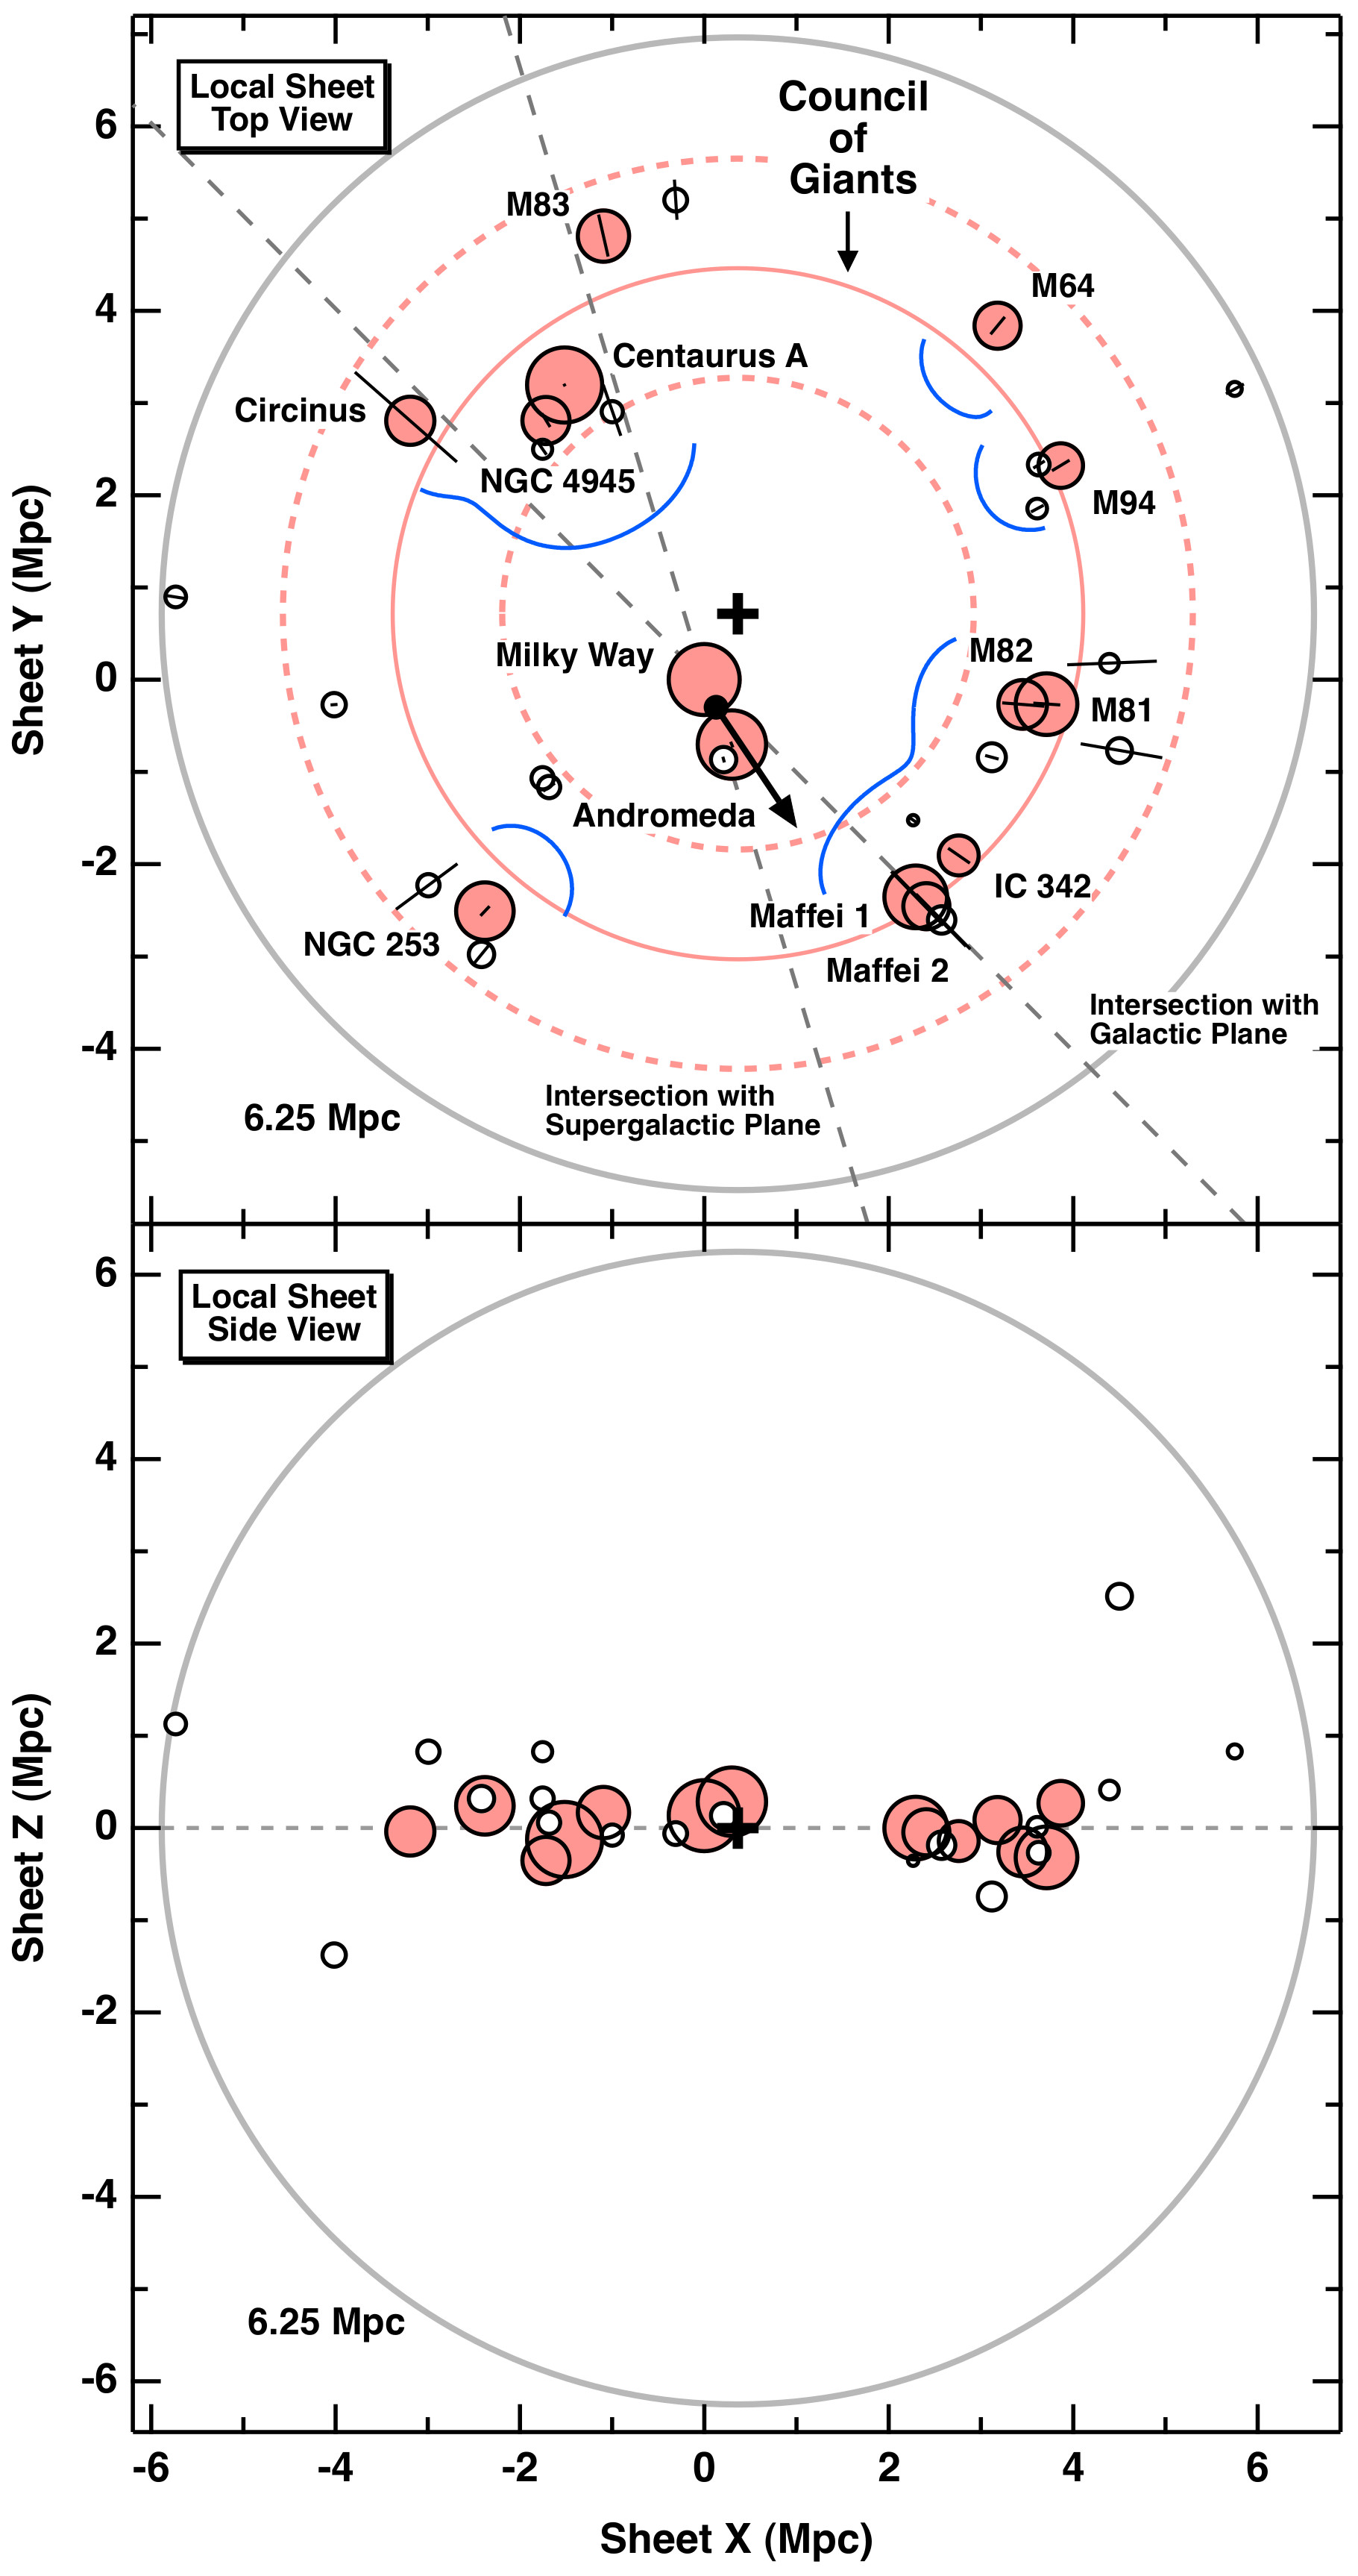
Figure 2:Local Sheet galaxies (Mpc) surrounding the local group (Mpc). From McCall (2014).
Opposite the galaxy NGC 253, about Mpc from the Milky Way, is the Virgo cluster of galaxies, which has a rugby ball structure, as can be seen below. Galaxy clusters can contain several thousand galaxies.
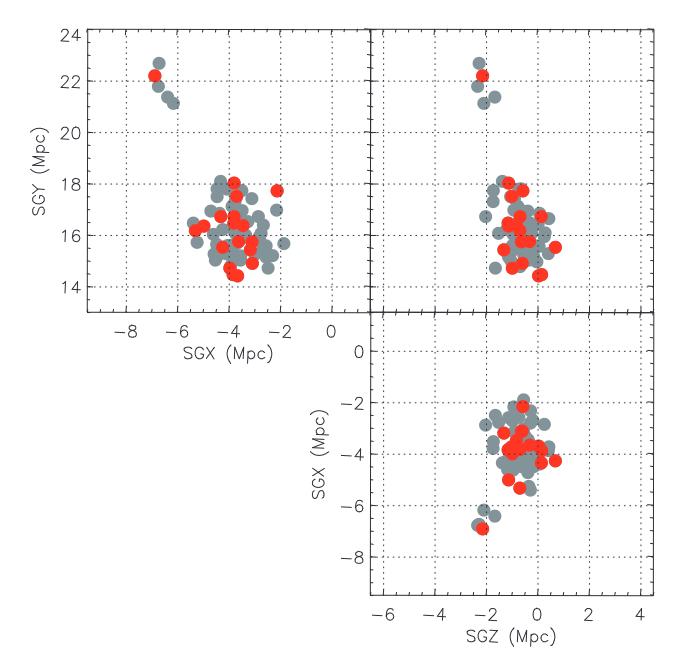
Figure 3:Spatial distribution of galaxies in the Virgo cluster with well constrained distances in supergalactic coordinates (the supergalactic plane is an historical structure almost identical to the Local Sheet, with a tilt of 8°). The brightest galaxies are shown in red. From Mei et al. (2007).
Clusters of galaxies such as Virgo are connected to the cosmic web by filaments of galaxies, whose position in the celestial plane and radial velocity projection can be inferred by spectroscopy, as illustrated below.
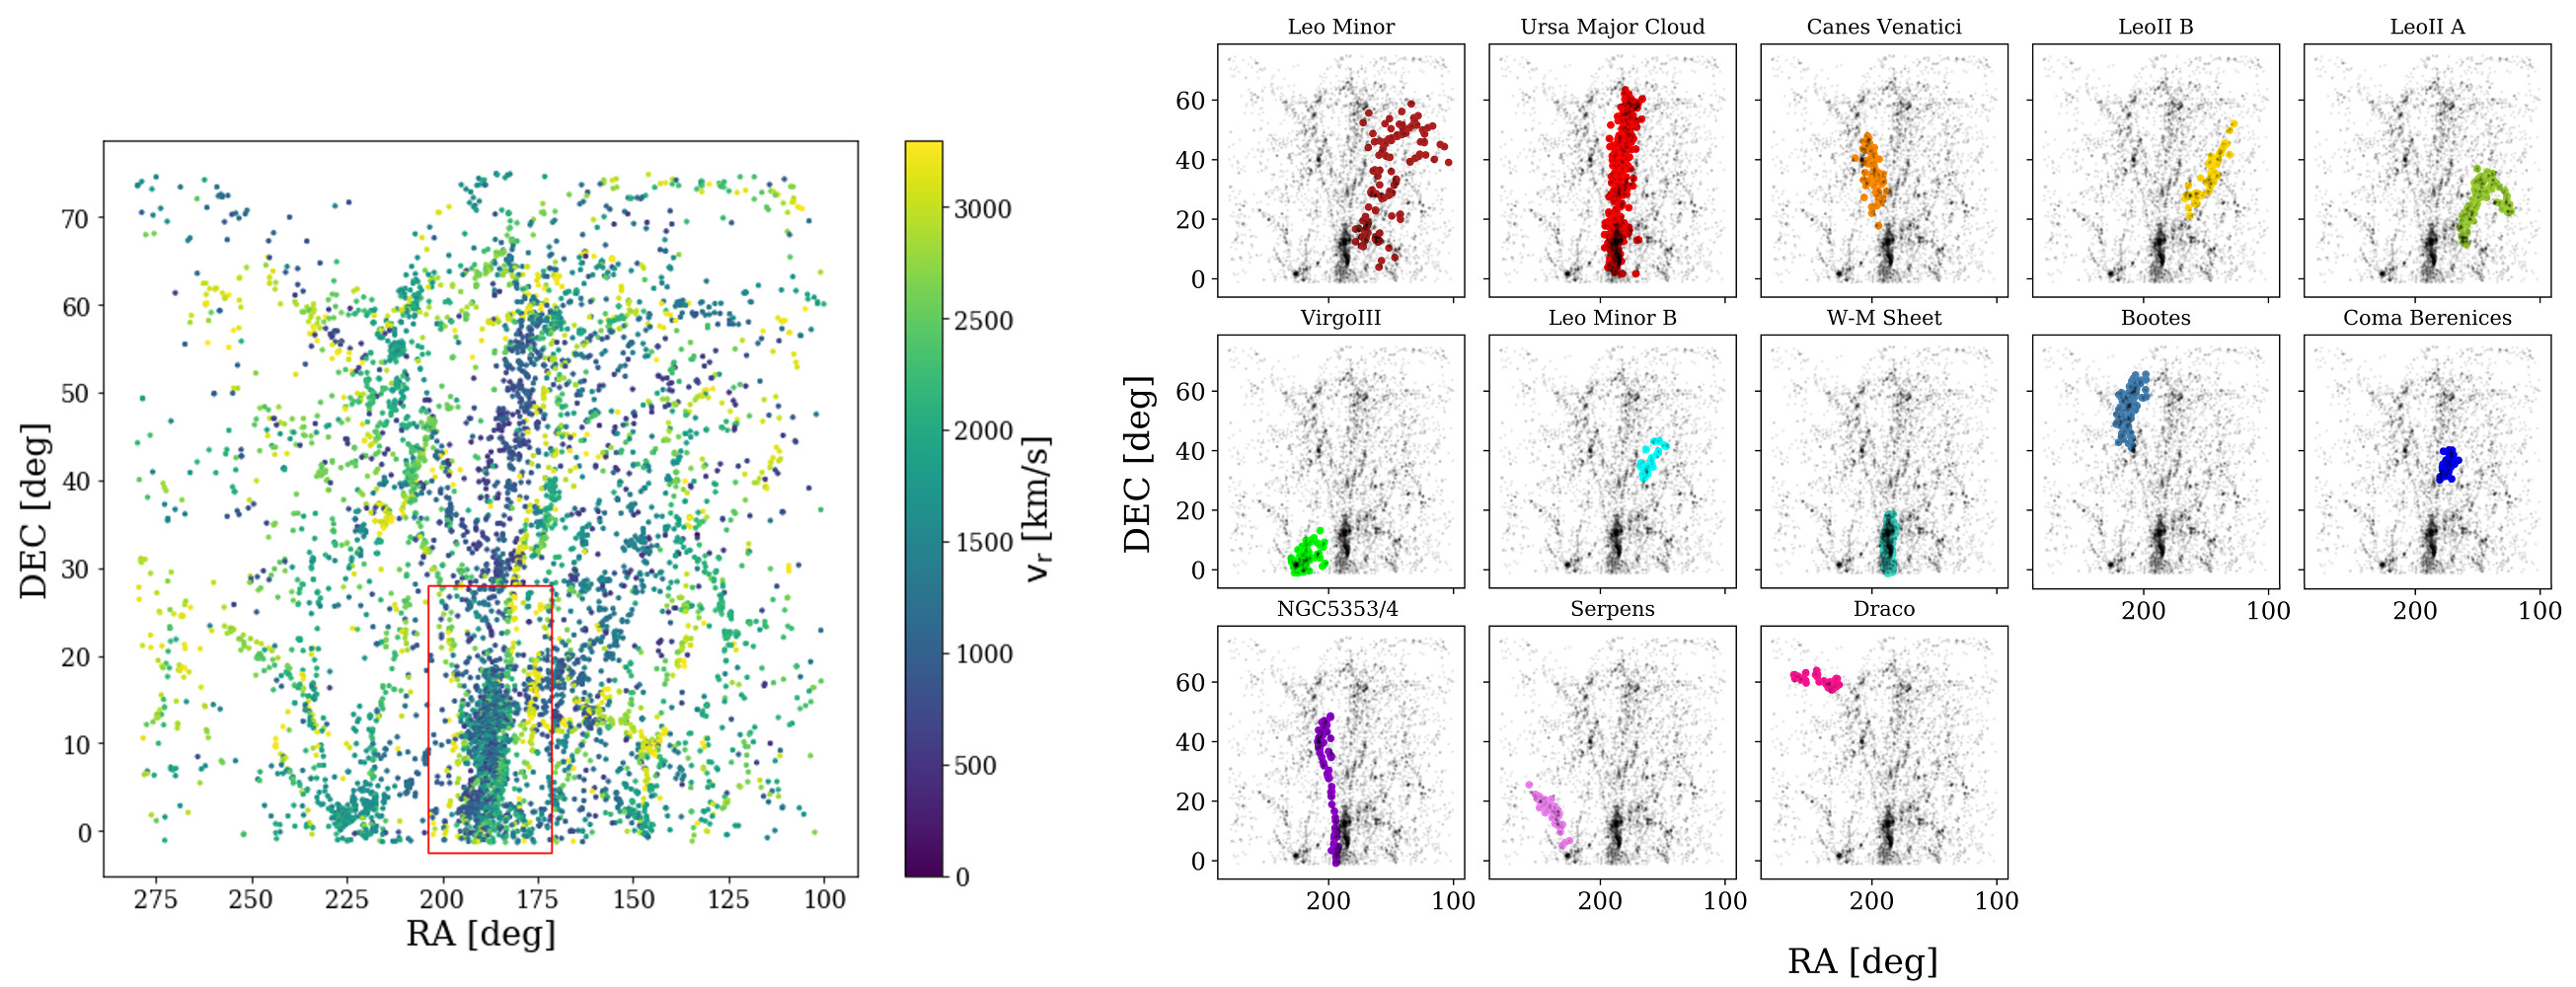
Figure 4:The filaments around the Virgo cluster. The distribution of galaxies in the sky is shown in equatorial coordinates (right ascension, R.A., and declination, Dec, in degrees). From Castignani et al. (2022).
On an even larger scale, typically Mpc, the clusters are grouped into superclusters such as Laniakea, which hosts us.
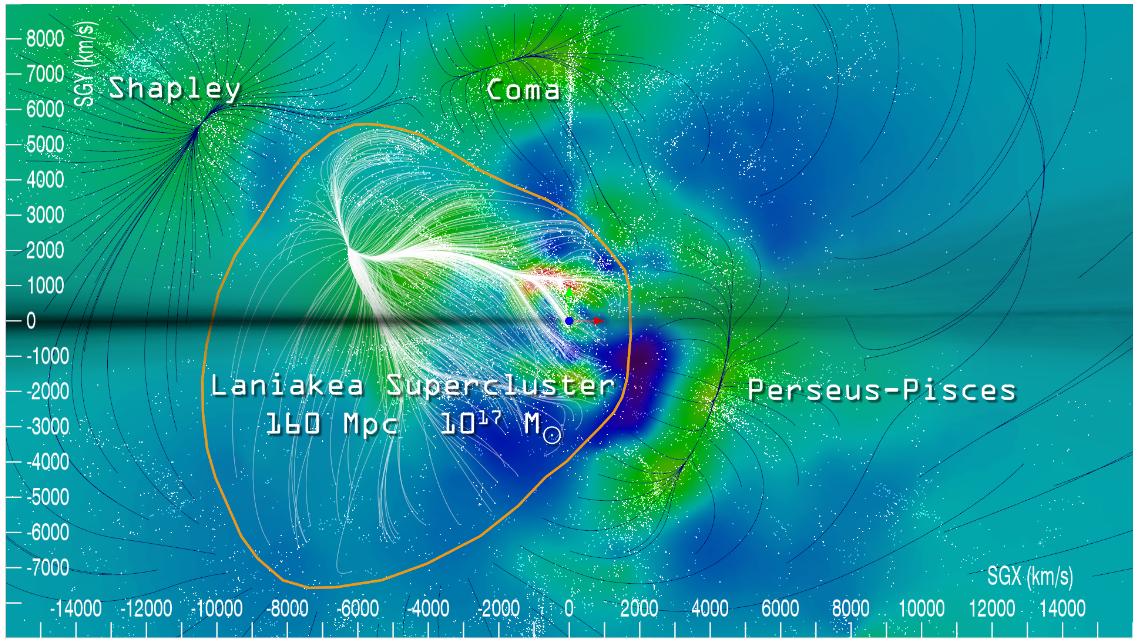
Figure 5:The local superclusters. Velocity streamlines of our supercluster, Laniakea, are shown in white. From Tully et al. (2014).
Mass of local large-scale structures
Not only can astronomers measure the position of galaxies in the sky, they can also measure the radial component of their velocity as well as their distance using the stars that calibrate the cosmic distance ladder. The velocity field of galaxies can thus be used to constrain the gravitational field of Laniakea or its companion supercluster Perseus-Pisces. The mass of the Laniakea supercluster is estimated at Tully et al., 2014. [1] On a smaller scale, the mass of the Virgo cluster is estimated at Planck Collaboration et al., 2016. Such dynamical arguments also yield an estimate of the mass of the Local Group of galaxies at . The Local Group dynamical mass is dominated by that of the Milky Way, and Andromeda, Benisty et al., 2022.
These masses are deduced using dynamical arguments such as the virial theorem (|kinetic energy| = |potential energy|/2 for a system at equilibrium) or using the projected trajectories of the tracers. Using stars as tracers, astronomers estimate the mass of the central black hole of the Milky Way, Sgr A*, at GRAVITY Collaboration et al., 2019 (see Figure 6 ). The latter has a small contribution to the mass of our galaxy compared with the stars that make it up Licquia & Newman, 2015. The mass of the Milky Way contained in baryons (stars and dust) is itself about 20 times less than its dynamic mass.
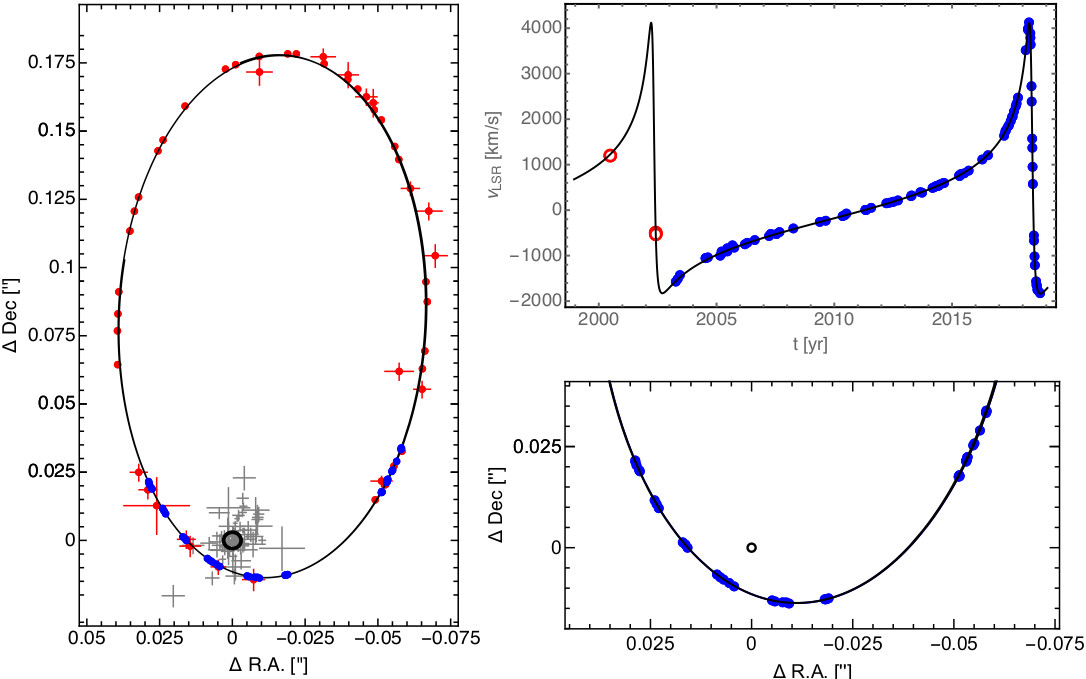
Figure 6:The 16-year orbit of the star S2 around the massive black hole Sgr A*, which has also been followed spectroscopically for 27 years. From GRAVITY Collaboration et al. (2019).
The mass deficit (dynamical minus baryonic mass) observed in the Milky Way is also inferred at the level of galaxy populations. The stellar mass of each galaxy can be estimated using near-infrared observations. At these wavelengths (around µm), the emission from medium-sized stars like the Sun is high compared with that from dust, which emits mainly at wavelengths greater than µm, and with that from more massive and younger stars, which emit mainly in the UV and blue band.
Solution to Exercise 2
The first panel represents the function such as , where is the considered volume and where . As , we find .
From the first panel, we estimate by eye a cut-off at where the density is . We find . The index is similarly estimated at .
The stellar mass energy density is then
Estimation using the exact form of the mass distribution function gives a stellar matter density up to or Mpc of , where . This corresponds to an energy density comparable to our crude estimate, namely
Cosmic energy inventory
For an energy density today equal to the critical density , i.e. GeVm, where , the solution of Exercise 2 shows that only two thousandths of the universe’s energy budget is made up of stars. A detailed breakdown of the different energy budgets of the universe is shown below.
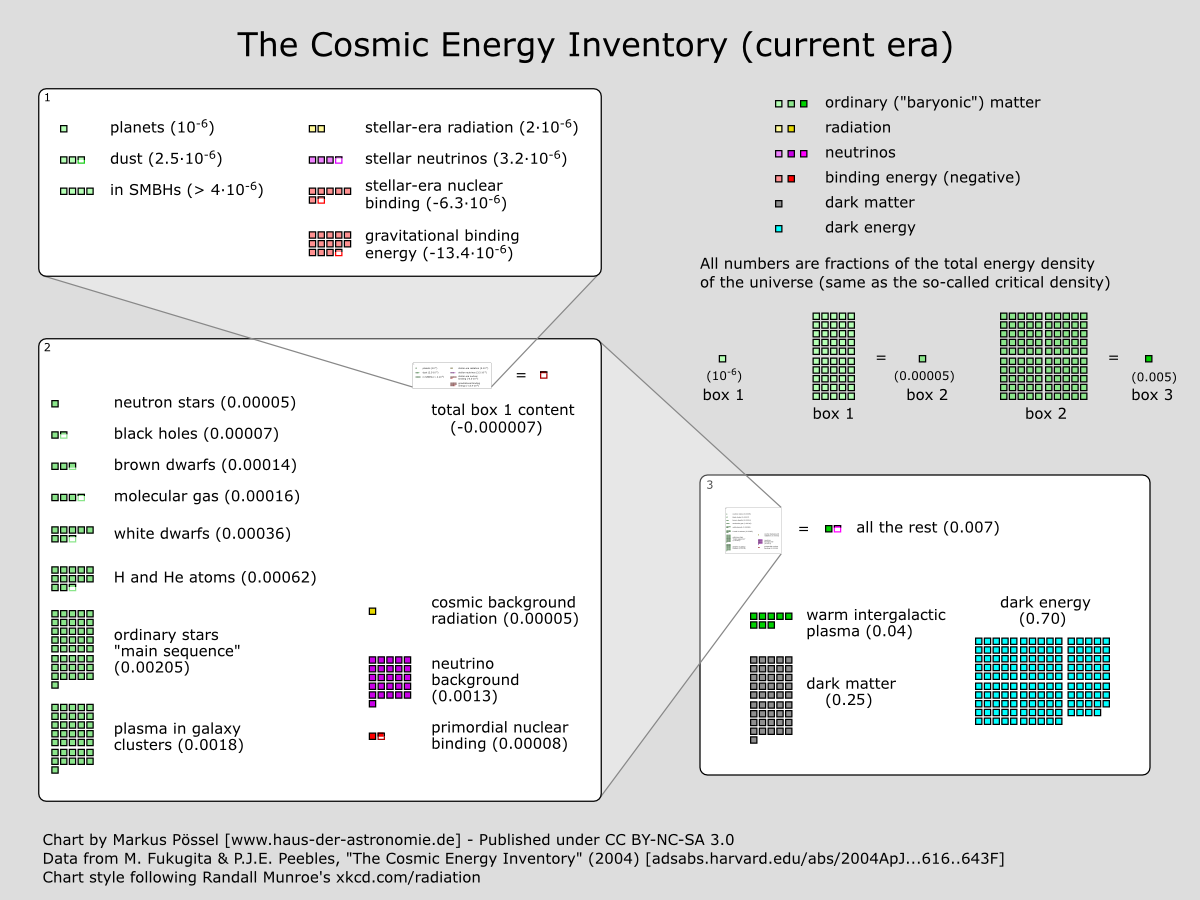
Figure 8:The cosmic energy inventory of Fukugita & Peebles (2004). Adapted from this page.
2Cosmic-scale engines behind astrophysical emissions
The processes responsible for most astrophysical emissions are star formation, the accretion of baryonic matter and the ejection of plasma jets by black holes, particularly supermassive black holes (with masses ) .
Star formation
The evolution of baryonic matter and light emission follows the cosmic history of formation of stars. Their rate of formation per unit comoving volume is illustrated in Figure 9.
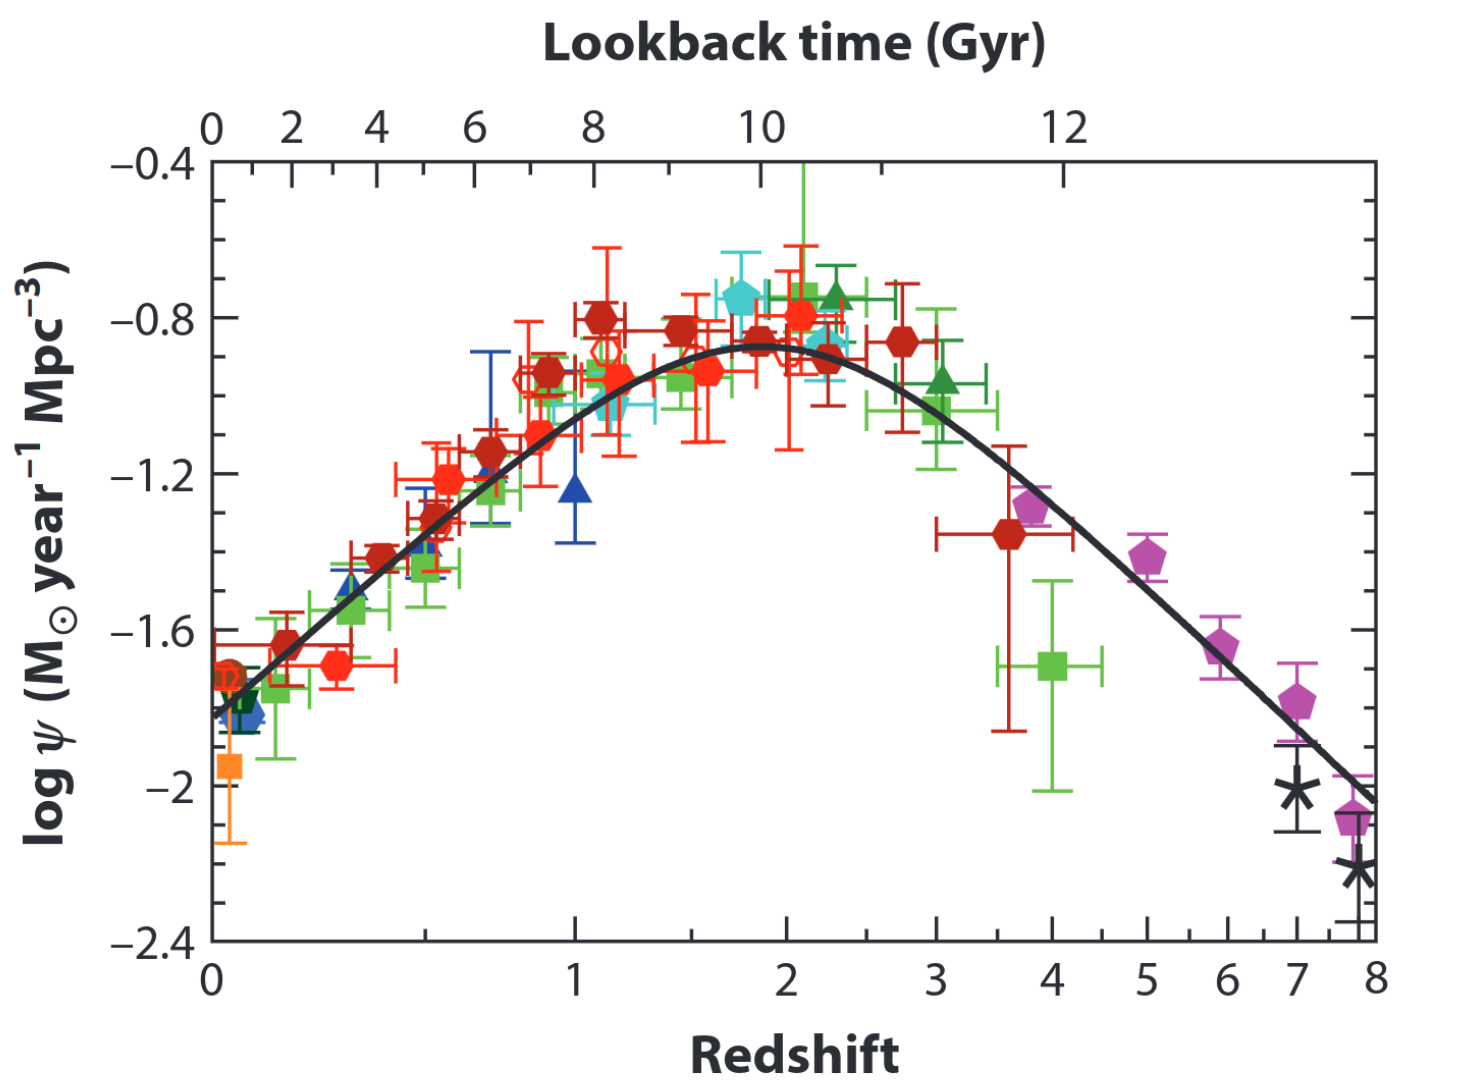
Figure 9:The cosmic star-formation rate history. From Madau & Dickinson, 2014.
In this figure, the redshift, which is defined by the relation with the scale factor and , is converted to cosmological age using a flat CDM cosmology, with Hubble constant and dark energy density , i.e. with . The look-back time is the counterpart of the cosmic age, i.e. , where
That is, in a flat CDM model with (radiation negelected):
with a negligible contribution from the energy density associated with the radiation, .
The evolution of the star-formation rate, , determines the evolution of the fraction of the baryonic mass contained in stars and gas, as well as the enrichment of the interstellar medium in galaxies. For example, the mass density contained in stars, shown in Figure 10, can be calculated from the following conservation equation:
Here is the “return fraction”, i.e. the proportion of matter reinjected into the interstellar medium by stellar winds and explosions. The value of is estimated at , depending on the initial distribution of stellar mass in a typical galaxy, which is called the initial mass function.
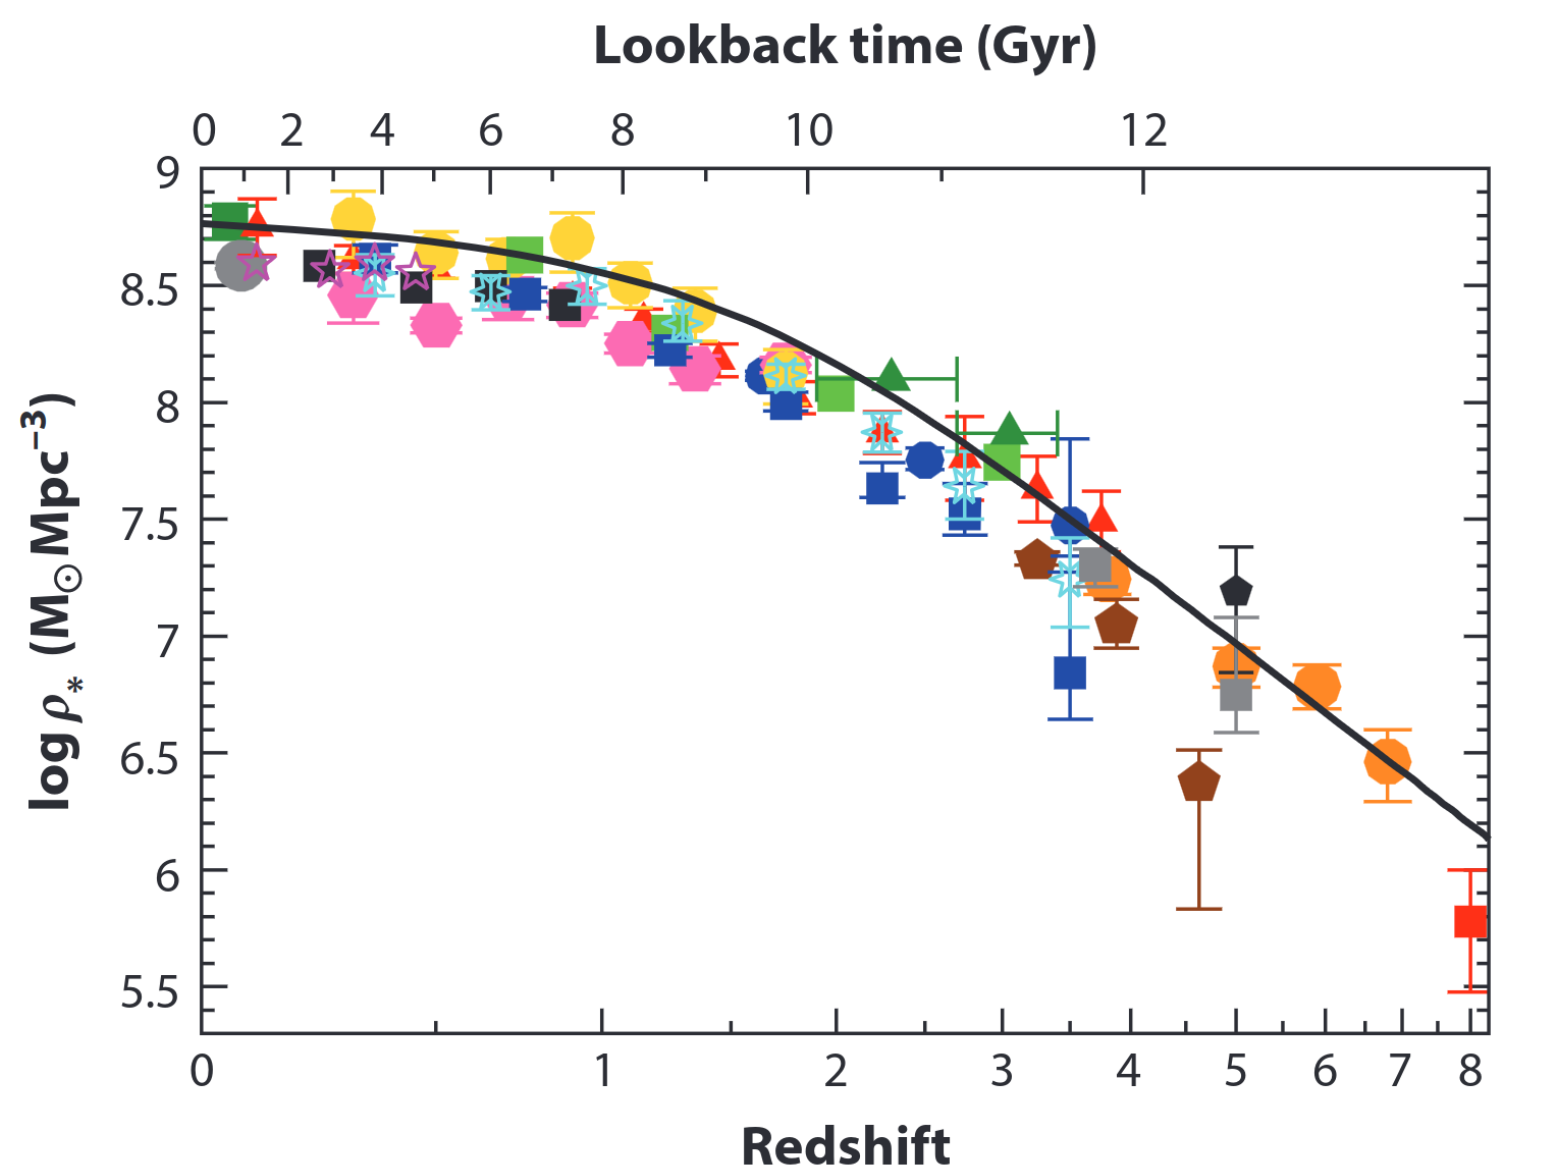
Figure 10:Cosmic evolution of the stellar mass density. From Madau & Dickinson, 2014.
The evolution of star formation in the universe, which is shown in Figure 9 has led to an enrichment of interstellar media in atoms heavier than carbon, known as metals in thermal astrophysics. This enrichment is due to nucleosynthesis in the first stars from primordial hydrogen and helium (see pp chain and CNO cycle). These first stars, known as Population III stars, contributed to the reionisation of their environment during their short lifetime of a few million years. The most massive stars () exploded in supernovae and ejected metals that fuelled subsequent generations of stars, and so on up to the Sun, which belongs to Population I. Gas, molecules - such as the most abundant H and CO - and dust - in the form of carbonaceous and amorphous silicate grains - continued to accumulate in the interstellar medium throughout the first three billion years of the universe until the cosmic peak of star formation around a redshift . This period of enhanced star formation is known as the “cosmic noon”. Since then, the universe has been populated mainly by long-lived Population I stars, typically Gyr for the Sun. Their average rate of formation has decreased as the reservoir of gas available in the interstellar medium has been depleted until today.
As with the mass of matter contained in stars today, the cumulative emission of nucleosynthesis processes is proportional to the integral of the cosmic star-formation rate.
Solution to Exercise 3
The efficiency of matter-to-light conversion in the Sun is therefore only one tenth of the theoretical maximum efficiency. It should be noted that although the pp chain is dominant within the Sun, this does not mean that all its protons are involved in the fusion processes.
For comparison, the energy density contained in CMB is twenty times greater, i.e. (or ).
Accretion
Galaxies formed in a hierarchical fashion, first by the concentration of baryonic matter in their low-mass halos, then by merging with other galaxies in the cosmic web. The evolution of galaxies is accompanied by the growth of their central massive black hole. The mass of these black holes, , is about two thousandths of the stellar mass of the bulge of the host galaxy Ding et al., 2020. This relation illustrates the co-evolution of central black holes and their host galaxies. Many other correlations between observables support this link: for example the relation between the black-hole mass and the dispersion of stellar velocities within spheroids (elliptical galaxy or central bulge for a spiral galaxy). The rate of accretion of matter by massive black holes thus follows an evolution, , comparable to that of the star-formation rate, with a density times lower as shown in Figure 10.
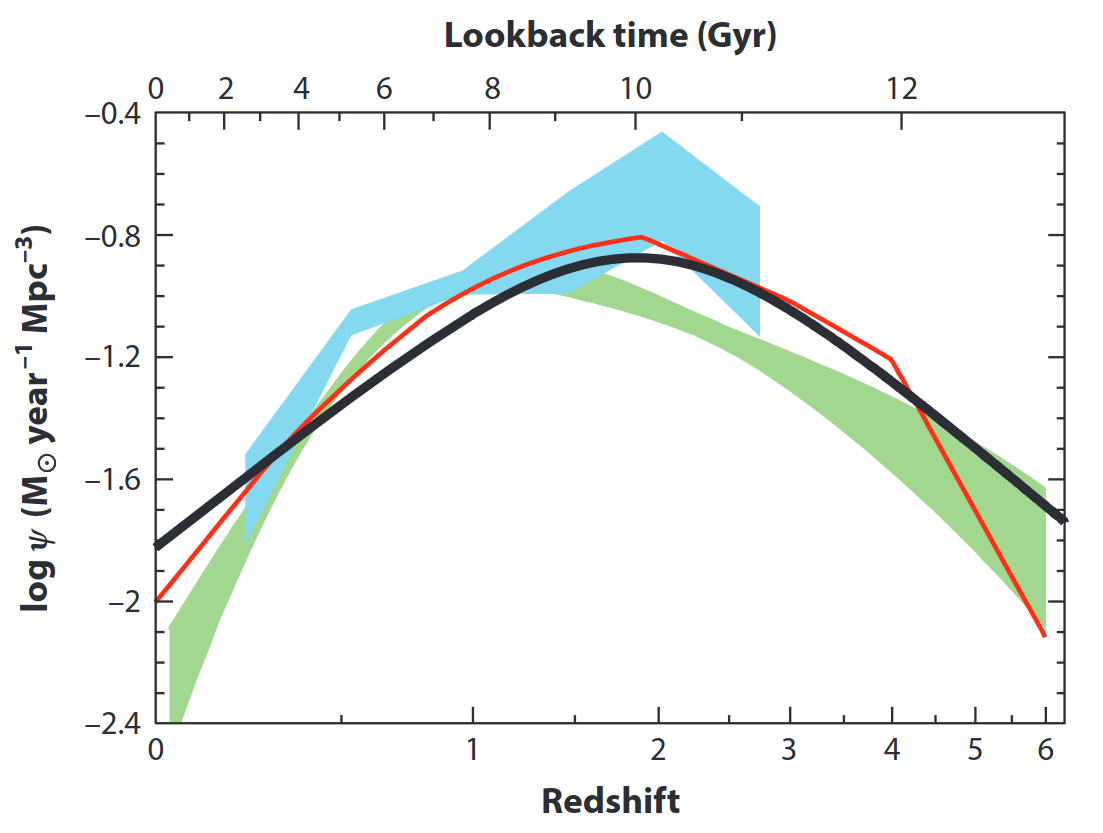
Figure 10:The evolution of the star-formation rate (black curve) and of the accretion rate of massive black holes (coloured curves and bands). The accretion-rate estimates are multiplied by a factor of to bring them up to the scale of the star-formation rate. From Madau & Dickinson, 2014.
Matter accretion around supermassive black holes is the second most important power-source for light emission after star formation. These accretion processes leave a particularly pronounced signature in galaxies with active nuclei (approximately 1% of all galaxies). These accretion processes can be seen most clearly in galaxies with active nuclei, which make up around 1% of all galaxies. Such active galactic nuclei, consisting of a supermassive black hole and an accretion disk, can exceed the combined luminosity of all the stars in the host galaxy.
The energy released by accretion in the form of photons can be estimated using Soltan’s argument Soltan, 1982. The energy of a test particle accreted by a black hole from the last marginally stable orbit is only a fraction of the rest-mass energy. The rest can be released in the form of radiation. The radiative efficiency of the accretion process, , is defined as the ratio of the radiated power to the rate of mass-energy deposition in the disc, measured by an observer at infinity. Taking into account the deceleration of the black hole’s rotation by the accreted photons, Thorne calculates a radiative efficiency of Thorne, 1974.[2]
Ejection
Around 10% of active galactic nuclei develop a jet on either side of the accretion disc Blandford et al., 2019. The presence of jets is deduced or observed in many astrophysical systems. This is the case for jetted AGNs, but also for long gamma-ray bursts that result from the collapse of massive stars, for short gamma-ray bursts that result from the mergers of of two compact objects (stellar-sized black holes or neutron stars), and for micro-quasar made of a compact object accreting matter from a companion star.
Plasma ejection in such jets results from the conversion of electromagnetic energy at their base into kinetic energy at their termination. The kinetic energy of the jets can be estimated for some active galactic nuclei by the size of the radio cavities they form in the intracluster medium Fabian, 2012. Synthetic evolution models that attempt to reproduce these observations estimate that of the mass energy associated with accretion is injected into the jets of active galactic nuclei Merloni & Heinz, 2008. However, the uncertainties surrounding the mechanisms of jet formation and the different accretion regimes mean that this ratio is merely a rough estimate of the balance between the kinetic energy and accreted energy.
The conversion of the Poynting flux (electromagnetic energy) into global plasma motion (kinetic energy) is accompanied by the acceleration of charged particles, for example by shock waves in the jets or at its boundary (shear), or by magnetic reconnection. Accelerated particles lose energy through radiative processes: synchrotron and inverse Compton for electrons and positrons, as well as production of pairs and pions for protons and nuclei. These radiative losses produce the emission of jets from radio waves to gamma rays. The efficiency of converting kinetic energy into radiation is estimated at for jets of active galactic nuclei, gamma-ray bursts and microquasars.
Solution to Exercise 4
Let us consider for the exercise . The fraction of mass actually accreted by the black hole is . The mass energy that can be converted into radiation is therefore .
For with , the energy density of the photon field emitted by the accretion processes is
Using the ratio of jet kinetic energy to accreted mass energy of and assuming that 10% of the kinetic energy goes to radiation, we obtain an energy conversion factor between accreted mass and photon emission by the jets on cosmic scales. The energy density of photons radiated by the jets should then be of the order of
The emission produced by accretion is not negligible, especially if we realise that only 1% of galaxies have an active nucleus Haggard et al., 2010.
Now that we have estimated the energy densities associated with the photon fields emitted by the three major astrophysical processes, we can compare them with observations, as covered in the next course.
- Freidel, L., & Livine, E. R. (2019). Bubble networks: framed discrete geometry for quantum gravity. General Relativity and Gravitation, 51(1), 9. 10.1007/s10714-018-2493-y
- Oei, M. S. S. L., van Weeren, R. J., Vazza, F., Leclercq, F., Gopinath, A., & Röttgering, H. J. A. (2022). Filamentary baryons and where to find them. A forecast of synchrotron radiation from merger and accretion shocks in the local Cosmic Web. \aap, 662, A87. 10.1051/0004-6361/202140364
- Haider, M., Steinhauser, D., Vogelsberger, M., Genel, S., Springel, V., Torrey, P., & Hernquist, L. (2016). Large-scale mass distribution in the Illustris simulation. \mnras, 457(3), 3024–3035. 10.1093/mnras/stw077
- McCall, M. L. (2014). A Council of Giants. \mnras, 440(1), 405–426. 10.1093/mnras/stu199
- Mei, S., Blakeslee, J. P., Côté, P., Tonry, J. L., West, M. J., Ferrarese, L., Jordán, A., Peng, E. W., Anthony, A., & Merritt, D. (2007). The ACS Virgo Cluster Survey. XIII. SBF Distance Catalog and the Three-dimensional Structure of the Virgo Cluster. \apj, 655(1), 144–162. 10.1086/509598
- Castignani, G., Vulcani, B., Finn, R. A., Combes, F., Jablonka, P., Rudnick, G., Zaritsky, D., Whalen, K., Conger, K., De Lucia, G., Desai, V., Koopmann, R. A., Moustakas, J., Norman, D. J., & Townsend, M. (2022). Virgo Filaments. II. Catalog and First Results on the Effect of Filaments on Galaxy Properties. \apjs, 259(2), 43. 10.3847/1538-4365/ac45f7
- Tully, R. B., Courtois, H., Hoffman, Y., & Pomarède, D. (2014). The Laniakea supercluster of galaxies. \nat, 513(7516), 71–73. 10.1038/nature13674
- Planck Collaboration, Ade, P. A. R., Aghanim, N., Arnaud, M., Ashdown, M., Aumont, J., Baccigalupi, C., Banday, A. J., Barreiro, R. B., Bartolo, N., Battaner, E., Benabed, K., Benoit-Lévy, A., Bernard, J. P., Bersanelli, M., Bielewicz, P., Bonaldi, A., Bonavera, L., Bond, J. R., … Zonca, A. (2016). Planck intermediate results. XL. The Sunyaev-Zeldovich signal from the Virgo cluster. \aap, 596, A101. 10.1051/0004-6361/201527743
- Benisty, D., Vasiliev, E., Evans, N. W., Davis, A.-C., Hartl, O. V., & Strigari, L. E. (2022). The Local Group Mass in the Light of Gaia. \apjl, 928(1), L5. 10.3847/2041-8213/ac5c42
- GRAVITY Collaboration, Abuter, R., Amorim, A., Bauböck, M., Berger, J. P., Bonnet, H., Brandner, W., Clénet, Y., Coudé Du Foresto, V., de Zeeuw, P. T., Dexter, J., Duvert, G., Eckart, A., Eisenhauer, F., Förster Schreiber, N. M., Garcia, P., Gao, F., Gendron, E., Genzel, R., … Yazici, S. (2019). A geometric distance measurement to the Galactic center black hole with 0.3% uncertainty. \aap, 625, L10. 10.1051/0004-6361/201935656
- Licquia, T. C., & Newman, J. A. (2015). Improved Estimates of the Milky Way’s Stellar Mass and Star Formation Rate from Hierarchical Bayesian Meta-Analysis. \apj, 806(1), 96. 10.1088/0004-637X/806/1/96
- Driver, S. P., Bellstedt, S., Robotham, A. S. G., Baldry, I. K., Davies, L. J., Liske, J., Obreschkow, D., Taylor, E. N., Wright, A. H., Alpaslan, M., Bamford, S. P., Bauer, A. E., Bland-Hawthorn, J., Bilicki, M., Bravo, M., Brough, S., Casura, S., Cluver, M. E., Colless, M., … Wilkins, S. M. (2022). Galaxy And Mass Assembly (GAMA): Data Release 4 and the z < 0.1 total and z < 0.08 morphological galaxy stellar mass functions. \mnras, 513(1), 439–467. 10.1093/mnras/stac472
- Fukugita, M., & Peebles, P. J. E. (2004). The Cosmic Energy Inventory. \apj, 616(2), 643–668. 10.1086/425155
- Driver, S. (2021). The challenge of measuring and mapping the missing baryons. Nature Astronomy, 5, 852–854. 10.1038/s41550-021-01441-w
- Madau, P., & Dickinson, M. (2014). Cosmic Star-Formation History. \araa, 52, 415–486. 10.1146/annurev-astro-081811-125615