1Hadronic emissions on cosmic scales, hints & evidence for sources
The highest-energy extragalactic backgrounds shown in Figure 1 are not made of photons. They both trace unambiguously the acceleration of hadrons within astrophysical sources. The first one is the extragalactic neutrino background (ENB) in the energy range from TeV to PeV. To avoid confusion, we do not call it the cosmic neutrino background, which often refers in the literature to the K primeval background analogous to the CMB Vitagliano et al., 2020. The second one is the extragalactic cosmic-ray background (ECRB), made of protons of nuclei with energies from ranging fom PeV to EeV. The cosmic-ray flux observed at lower energies, down to GeV energies, is expected to be of Galactic origin as the magnetic field of the Milky Way (at the G level, i.e. around T) is sufficient to confine them. The transition region between few tens and few hundreds of PeV remains debated: both Galactic and extragalactic origins of these cosmic rays are proposed in the litterature. The sources of cosmic rays (protons, helium nuclei and ionized metals are difficult) to resolve because of the deflections of such charged particles in the magnetic fields encountered along their propagation. The cosmic-ray intensity from GeV to ZeV energies is thus observed to be mostly isotropic Deligny, 2019.
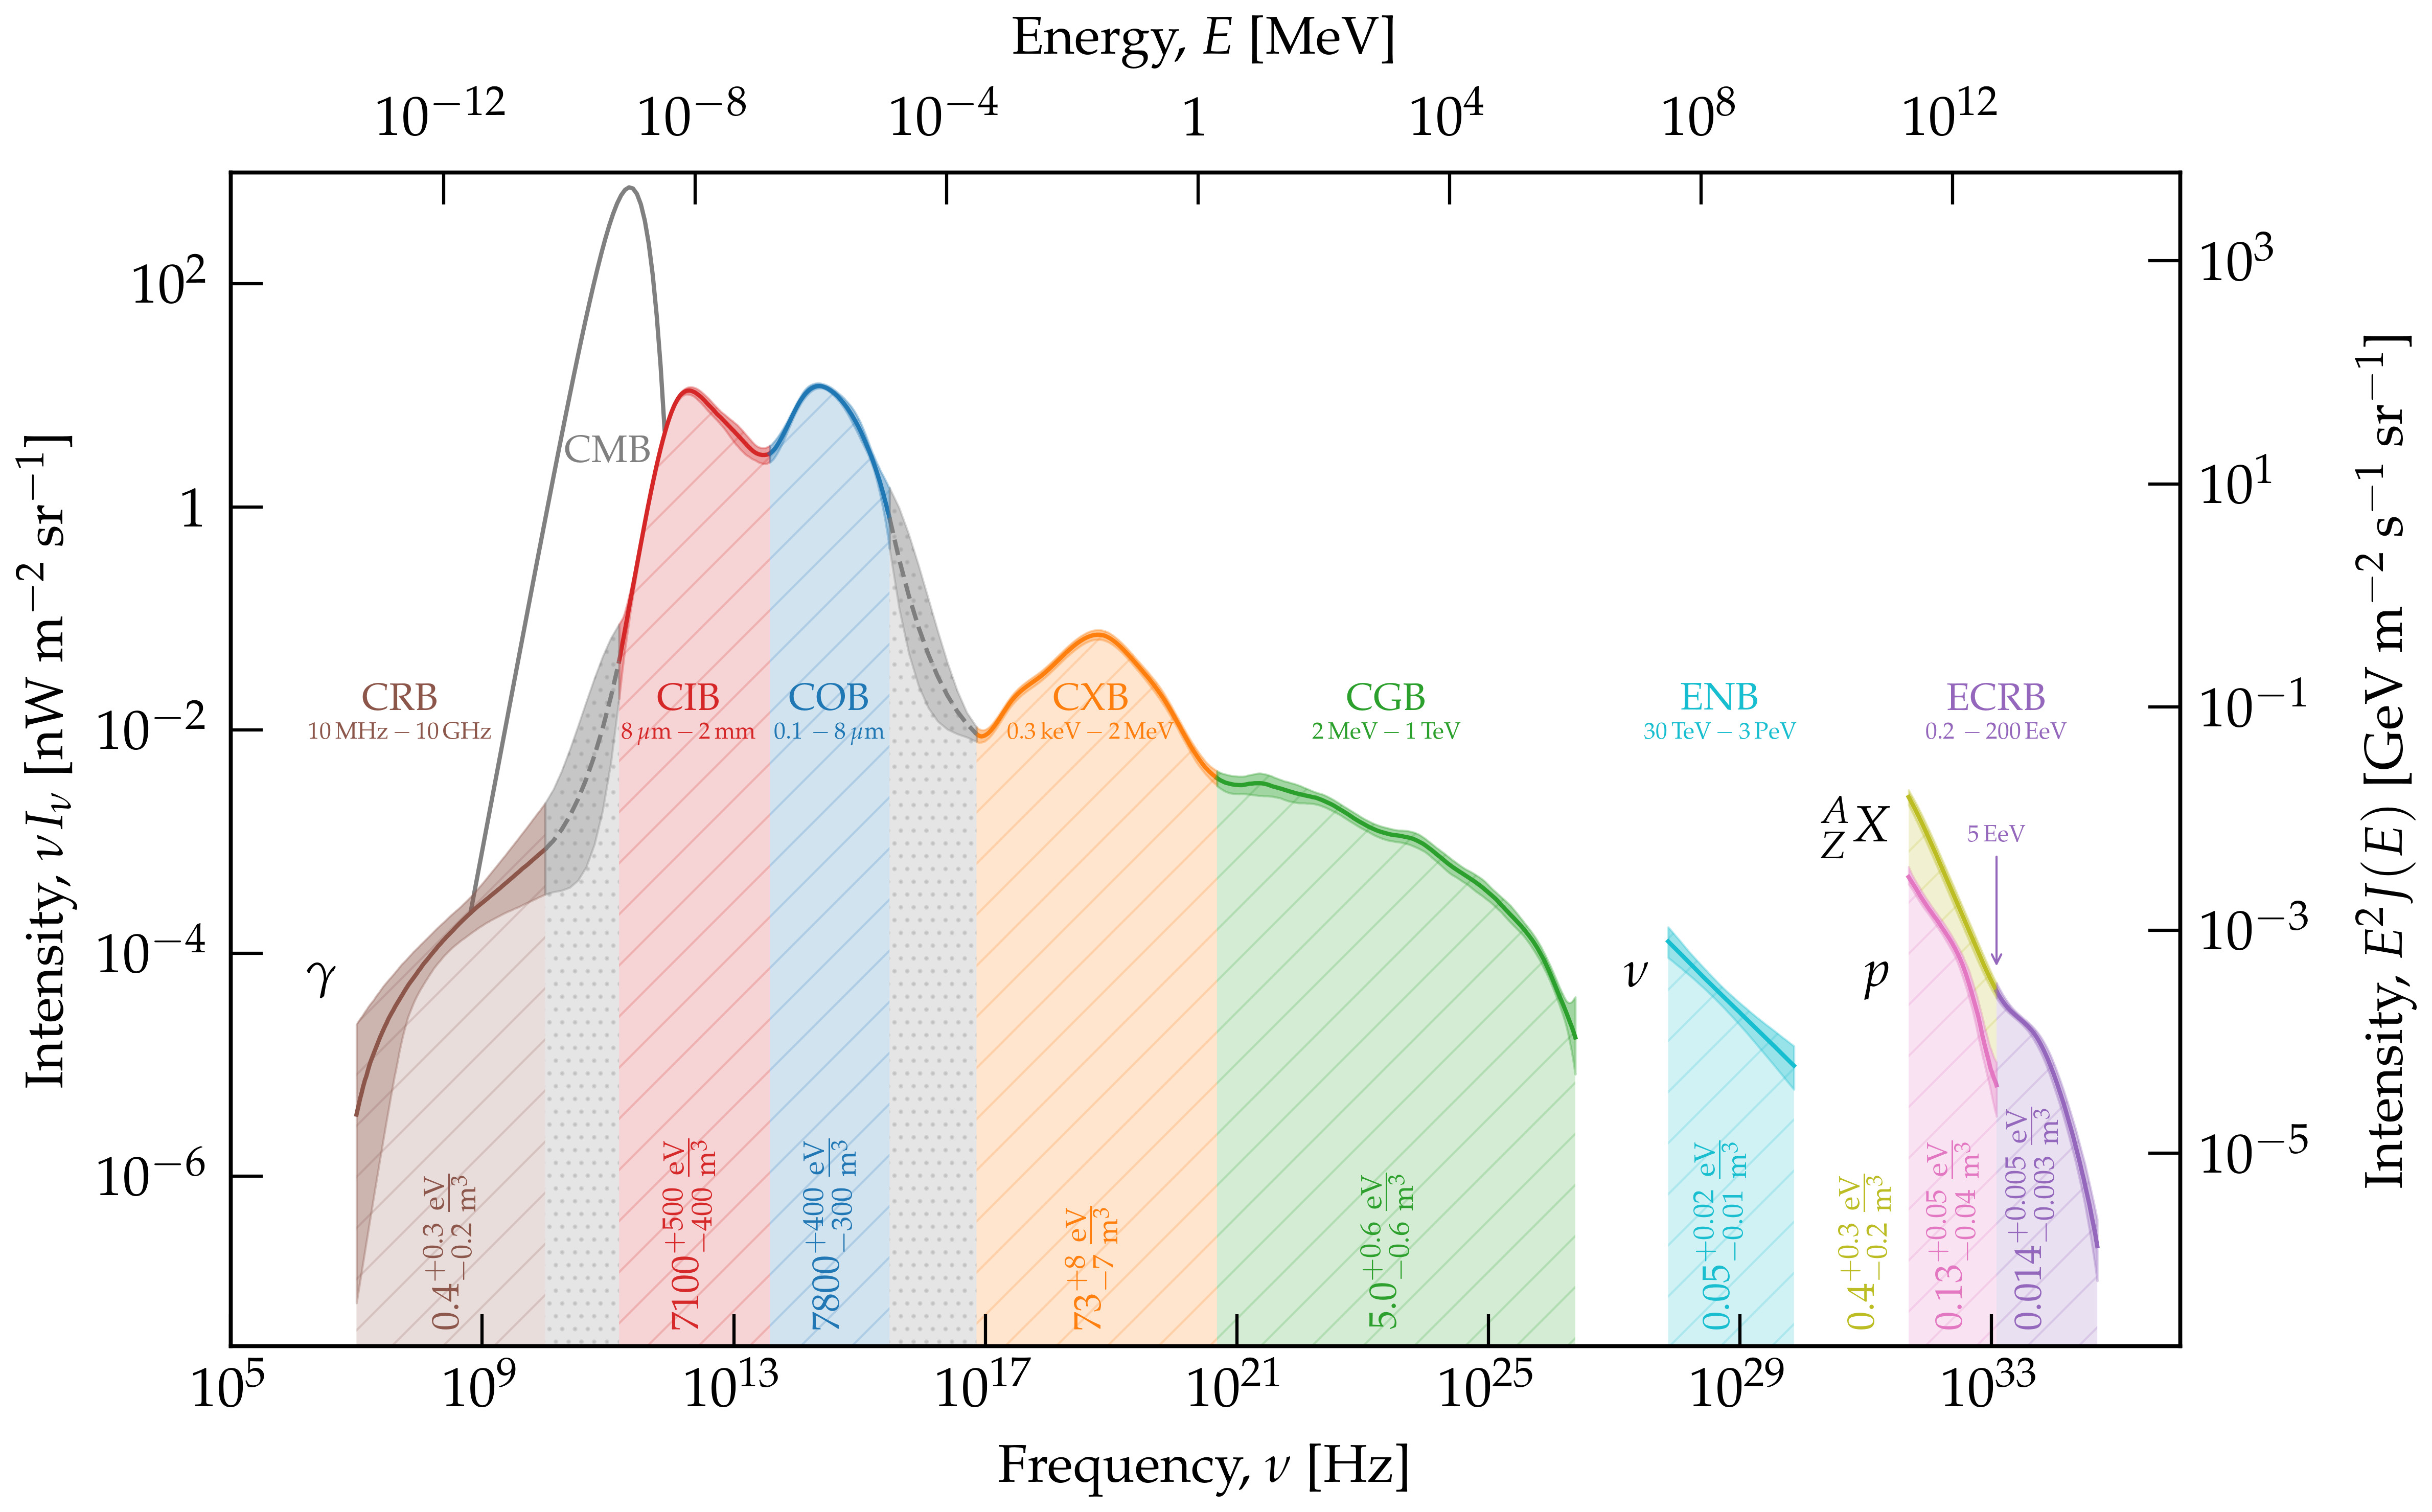
Figure 1:The multi-messenger extragalactic spectrum. Adapted from this page.
The extragalactic and Galactic neutrino backgrounds
Neutrinos at TeV-PeV energies are generated by the decay of pion and kaon mesons, themselves produced by the interactions of nucleons with matter or photon fields in the environment of the astrophysical accelerators Ahlers & Halzen, 2018. The ENB is the most recently detected extragalactic background IceCube Collaboration, 2013. Two obstacles made its measurement difficult: the detection of neutrinos themselves, which interact little with matter, and the subtraction of the more numerous neutrinos produced in the atmosphere by Galactic cosmic rays at TeVPeV energies.
Fortunately, the atmospheric neutrino spectrum is very soft, i.e. this spectrum is a steeply decreasing function of energy. The IceCube collaboration has been able to subtract atmospheric neutrino background at TeV energies and to detect the ENB by equipping with photomultiplier tubes a volume of ice of one cubic kilometer in Antarctica. Note that the three flavors (, , ) are expected in equal proportion on Earth, since they mix during their cosmic propagation.
No neutrino source at TeV-PeV energies is clearly detected to date. The most significant excess provides a evidence of an excess of neutrinos in the direction of the composite galaxy NGC,1068, which hosts a non-jetted AGN and a starburst nucleus IceCube Collaboration et al., 2022. Other indications at are identified by this analysis of 9 years of data in the directions of the blazars PKS 1424+240 () and TXS 0506+056 (). These indications are based on the spatial and temporal coincidence of a neutrino with a multi-month high state at GeV energies detected in 2017 by Fermi-LAT. Pending a firm detection at , it should be noted that the indications and evidence of excesses contribute no more than one percent of the ENB.
A non-negligible part of the effort led by the community today is focused on modeling neutrino source populations and the counterpart gamma-ray emission at GeV energies, as the production of charged pions that decay in neutrinos is accompanied by the production of neutral pions that decay in gamma-rays. An illustration of such strategies applied applied to emmission from the Milky Way is shown in Figure 2. A model of neutrino emission based on a gamma-ray inspired template results in a excess along the Galactic plane Icecube Collaboration et al., 2023.
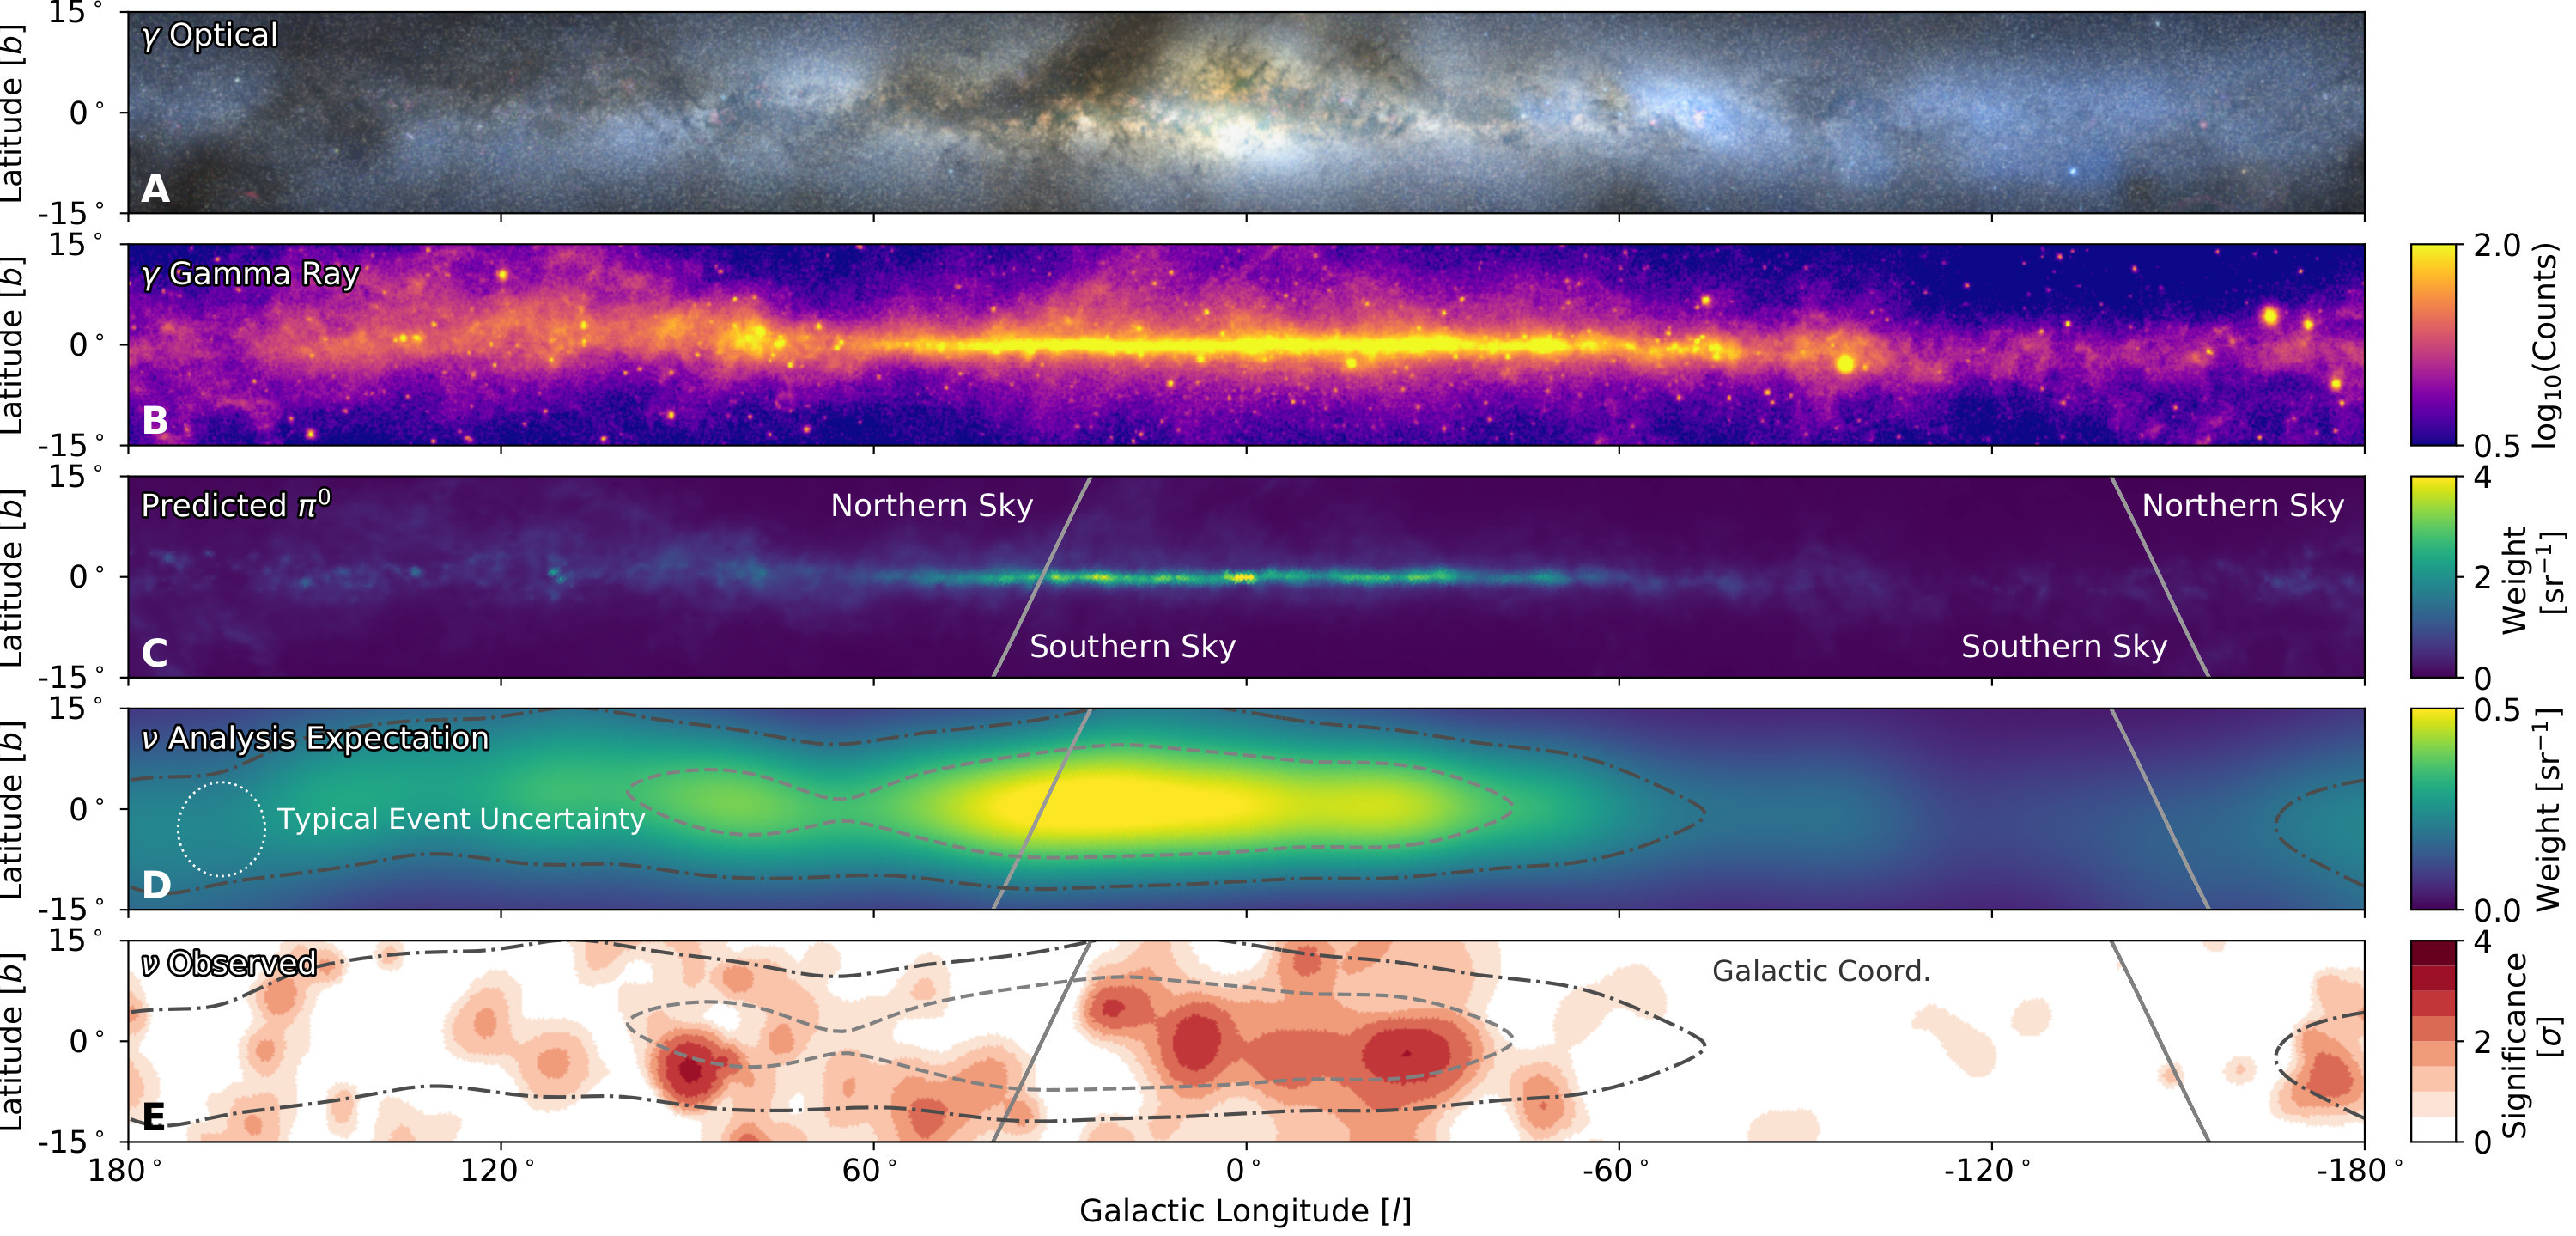
Figure 2:A multi-messenger view of the Galactic plane. The two top panels show the optical and GeV gamma-ray bands. The next two panels show the expected neutrino emission of the Milky Way from charged pion decays accounting or not for the angular resolution of the neutrino observatory. The last panel show the observations from IceCube at TeV energies. From Icecube Collaboration et al. (2023).
The extragalactic and Galactic cosmic-ray backgrounds
The differential intensity of cosmic rays, follows at first order a power law of spectral index up to the energy of the knee at about PeV, where it softens to reach a slope of Gabici et al., 2019. The presence of the knee around PeV can be understood as marking the maximum energy up to which protons are accelerated or magnetically confined in the Milky Way.
Solution to Exercise 1
We assume the photon field to be isotropic in the disc of Milky Way. Then, we can estimate the photon density as:
where is the net flux emitted from one side of the disc and . The total flux emitted by the two sides of the disc is , so that
i.e. two-to-three times the energy density of the CMB.
The local cosmic-ray intensity can be approximated as .
Considering the cosmic-ray velocity to be near the speed of light (which is wrong near GeV), the energy density of cosmic rays in the Milky Way above can be approximated by
Interestingly, the three components are close to equipartition.
The top panel in Figure 4 shows the same cosmic ray spectrum as in Figure 3 multiplied by a power law of index 2.7 in order to better see the different spectral breaks: is shown as a function of . Between the hip at a few hundred GeV and the knee at PeV, the cosmic-ray flux is well described to first order by a power law , followed by a break in slope around PeV corresponding to a softening of the spectrum (intensity decreasing more rapidly with energy), called the second knee. We will return to the link between the first and second knees in the next chapter. At higher energies, around the so-called anle energy at EeV, we observe a hardening of the spectrum (intensity decreasing less rapidly with energy), which is the signature of the extragalactic component of the cosmic-ray background. Finally, the cosmic-ray spectrum softens around EeV in the cut-off region.
The second panel in Figure 4 shows the evolution of the mean logarithm of the atomic mass, , of the observed cosmic rays as a function of energy. This logarithmic quantity is close to the observables reconstructed with the dedicated instruments. We observe that, on average, up to a few tens of GeV, i.e. the composition is dominated by protons. The composition is proton and helium up to the knee, then becomes heavier, possibly containing some iron at the second knee. The measurements between the second knee and the ankle are too sparse to be shown in the figure. Beyond the ankle, the composition becomes heavier again, ranging from helium to a mass close to that of the nuclei of carbon, nitrogen and oxygen.
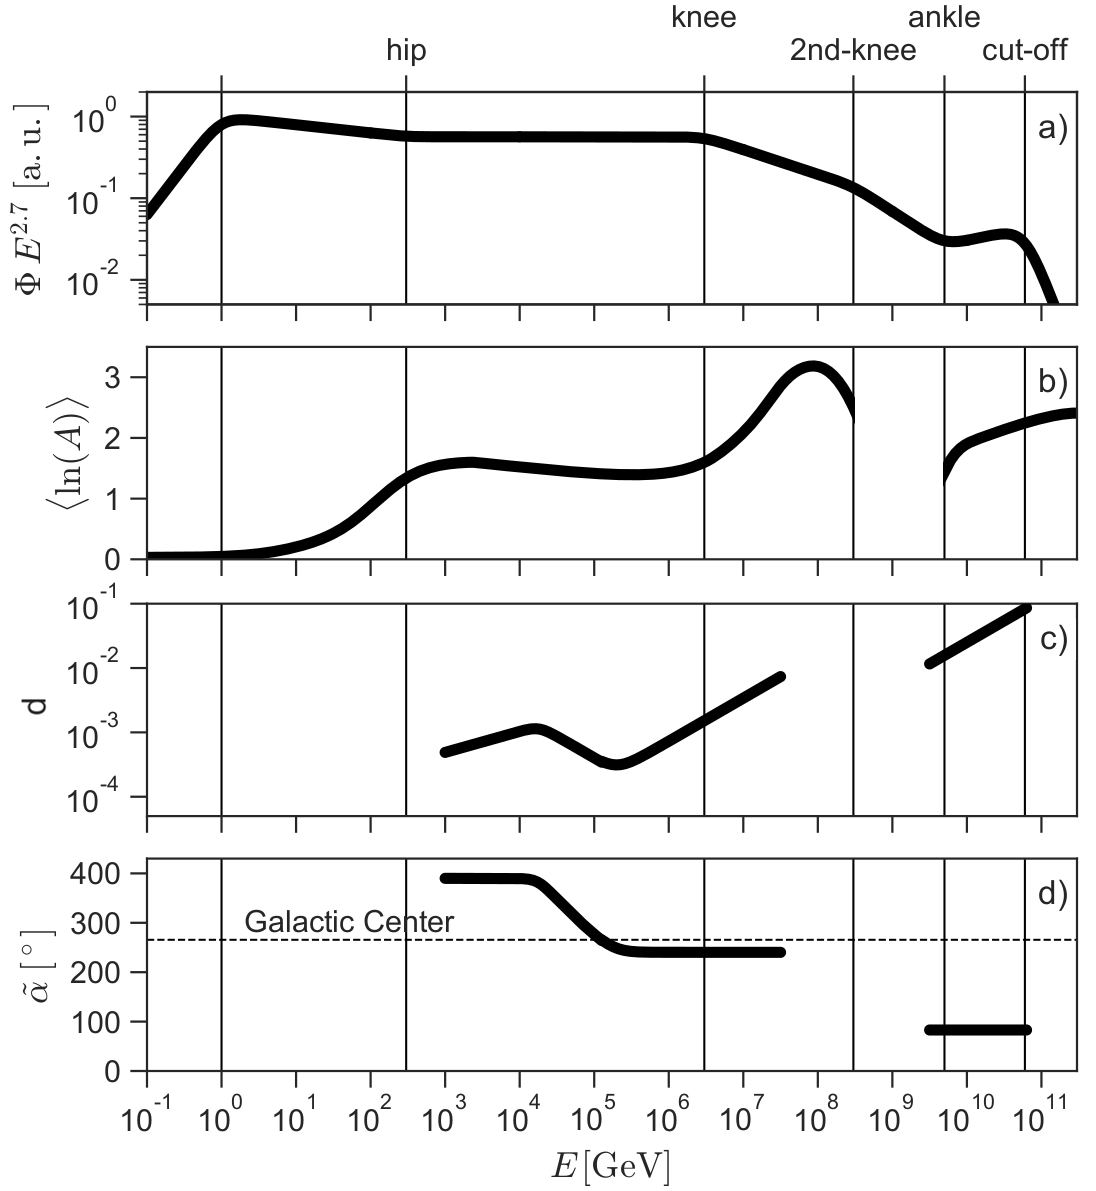
Figure 4:Simplified view of the cosmic-ray observables. The local cosmic-ray spectrum is scaled to a power in panel (a) to enhance the features. The mean logarithmic of cosmic-rays is shown in panel (b). Note that , and . The dipole amplitude and right-ascension are displayed in panels (c) and (d), which also includes the right ascension of the Galactic Center. Adapted from Becker Tjus & Merten (2020).
The third and fourth panels show the amplitude and right-ascension direction (see Figure 5) of the dipolar component of the cosmic-ray flux as a function of energy. As shown in the third panel and in Figure 6, the amplitude of the dipole around TeV relative to that of the monopole (isotropic component) is of the order of 10-3. This amplitude increases with energy in the range in which it is measured, reaching around ten per cent above the ankle.
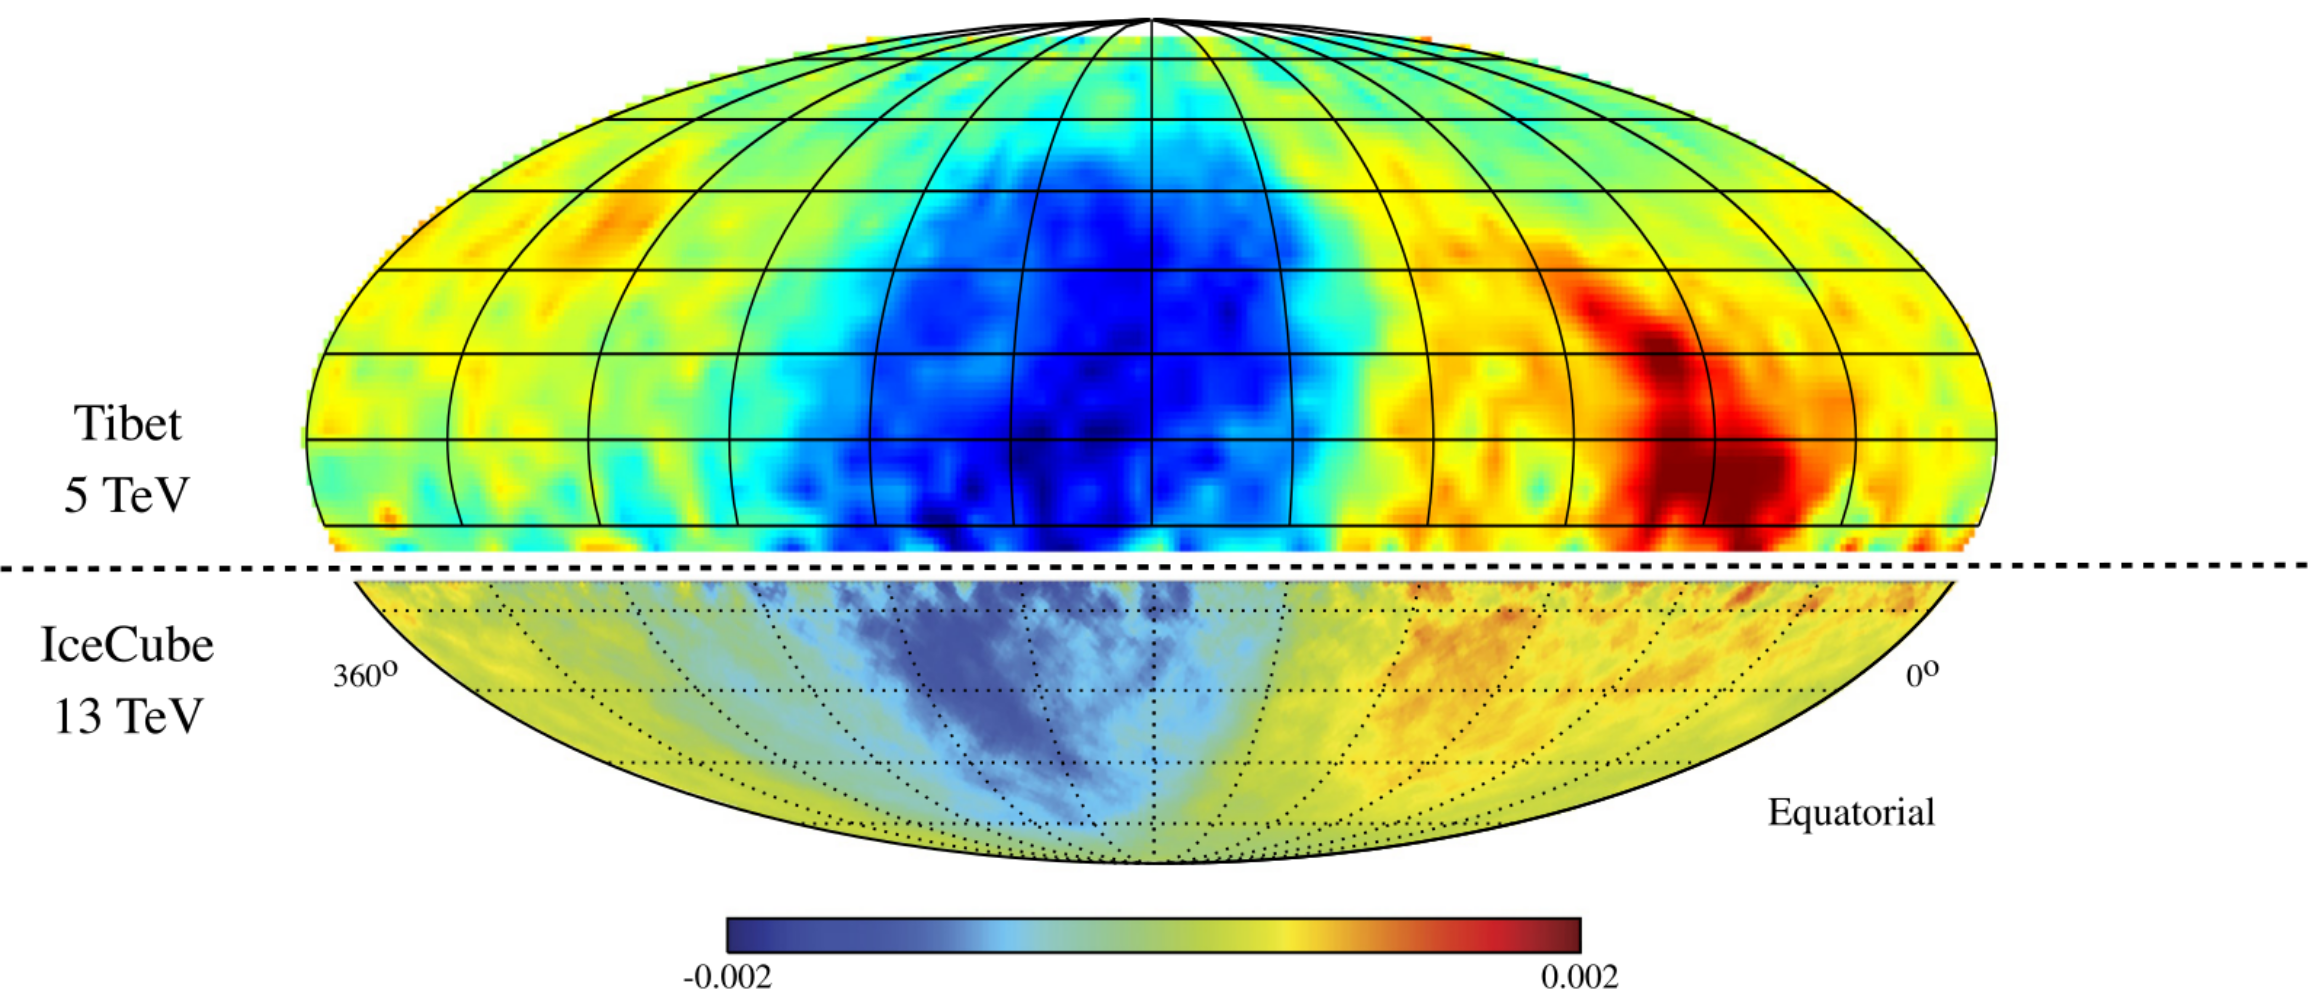
Figure 6:The cosmic-ray relative flux, at energies above TeV in equatorial coordinates, smoothed on a angular scale. Adapted by Becker Tjus & Merten (2020) from Ahlers & Mertsch (2017).
Observations of cosmic rays, dissected in terms of flux, composition and arrival direction, suggest the following paradigm. Cosmic rays are mainly of Galactic origin (i.e. from the Milky Way) up to the second knee. This is corroborated by the mean right ascension of their arrival directions aligned with that of the Galactic Centre around PeV energies. At lower energies, around TeV, these cosmic rays are affected by local magnetic fields, in particular those of the Local Bubble that extends to a few hundred pc around the Sun and is thought to have originated in a past supernova explosion.
Beyond the ankle, cosmic rays are too energetic to be confined by the Milky Way’s magnetic field. These cosmic rays are extragalactic, i.e. they come from galaxies other than our own. This is supported by the large and increasing amplitude of the dipole above EeV and by their arrival directions, which are in relatively good agreement with the direction expected from the distribution of galaxies within a few hundred Mpc.
As for the ENB, no source of the ECRB is clearly identified at the time of writing. The dipolar anisotropy of a few percent amplitude only allows the inference of a correlation of the ultra-high energy cosmic rays beyond the ankle with the distribution of extragalactic matter in the local universe. At higher energies, around the spectral break at EeV, the propagation of cosmic rays is limited to about Mpc for the CNO mass group, which are expected to dominate this energy range in synthetic models. A search volume limited to a hundred Mpc opens the possibility of detecting excesses in the direction of the nearest galaxies, clusters or superclusters. Targeted searches e.g.\towards the galaxy group dominated by Centaurus A , NGC 4945 and M 83 at a distance of Mpc and cross-correlations with multi-wavelength catalogs of nearby galaxies reveal evidence of anisotropy at on an angular scale of Abdul Halim et al., 2024. The most significant correlation observed by the Pierre Auger Observatory corresponds to a contribution of from nearby star-forming galaxies.
- Vitagliano, E., Tamborra, I., & Raffelt, G. (2020). Grand unified neutrino spectrum at Earth: Sources and spectral components. Reviews of Modern Physics, 92(4), 045006. 10.1103/RevModPhys.92.045006
- Deligny, O. (2019). Measurements and implications of cosmic ray anisotropies from TeV to trans-EeV energies. Astroparticle Physics, 104, 13–41. 10.1016/j.astropartphys.2018.08.005
- Ahlers, M., & Halzen, F. (2018). Opening a new window onto the universe with IceCube. Progress in Particle and Nuclear Physics, 102, 73–88. 10.1016/j.ppnp.2018.05.001
- IceCube Collaboration. (2013). Evidence for High-Energy Extraterrestrial Neutrinos at the IceCube Detector. Science, 342(6161), 1242856. 10.1126/science.1242856
- IceCube Collaboration, Abbasi, R., Ackermann, M., Adams, J., Aguilar, J. A., Ahlers, M., Ahrens, M., Alameddine, J. M., Alispach, C., Alves, Jr., A. A., Amin, N. M., Andeen, K., Anderson, T., Anton, G., Argüelles, C., Ashida, Y., Axani, S., Bai, X., Balagopal, A. V., … Zhelnin, D. P. (2022). Evidence for neutrino emission from the nearby active galaxy NGC 1068. Science, 378(6619), 538–543. 10.1126/science.abg3395
- Icecube Collaboration, Abbasi, R., Ackermann, M., Adams, J., Aguilar, J. A., Ahlers, M., Ahrens, M., Alameddine, J. M., Alves, A. A., Amin, N. M., Andeen, K., Anderson, T., Anton, G., Arguelles, C., Ashida, Y., Athanasiadou, S., Axani, S., Bai, X., Balagopal, V. A., … Zhelnin, P. (2023). Observation of high-energy neutrinos from the Galactic plane. Science, 380(6652), 1338–1343. 10.1126/science.adc9818
- Gabici, S., Evoli, C., Gaggero, D., Lipari, P., Mertsch, P., Orlando, E., Strong, A., & Vittino, A. (2019). The origin of Galactic cosmic rays: Challenges to the standard paradigm. International Journal of Modern Physics D, 28(15), 1930022–1930339. 10.1142/S0218271819300222
- Becker Tjus, J., & Merten, L. (2020). Closing in on the origin of Galactic cosmic rays using multimessenger information. \physrep, 872, 1–98. 10.1016/j.physrep.2020.05.002
- Ahlers, M., & Mertsch, P. (2017). Origin of small-scale anisotropies in Galactic cosmic rays. Progress in Particle and Nuclear Physics, 94, 184–216. 10.1016/j.ppnp.2017.01.004
- Abdul Halim, A., Abreu, P., Aglietta, M., Allekotte, I., Almeida Cheminant, K., Almela, A., Aloisio, R., Alvarez-Muñiz, J., Ammerman Yebra, J., Anastasi, G. A., Anchordoqui, L., Andrada, B., Andringa, S., Aramo, C., Araújo Ferreira, P. R., Arnone, E., Arteaga Velázquez, J. C., Asorey, H., Assis, P., … Mariazzi, A. G. (2024). Constraining models for the origin of ultra-high-energy cosmic rays with a novel combined analysis of arrival directions, spectrum, and composition data measured at the Pierre Auger Observatory. \jcap, 2024(1), 022. 10.1088/1475-7516/2024/01/022
- Mollerach, S., & Roulet, E. (2018). Progress in high-energy cosmic ray physics. Progress in Particle and Nuclear Physics, 98, 85–118. 10.1016/j.ppnp.2017.10.002